Essential Apps for Jira to Check How Work Gets Done
Created by seasoned Atlassian product experts
Performance Objectives
Interactive Jira dashboard charts and reports
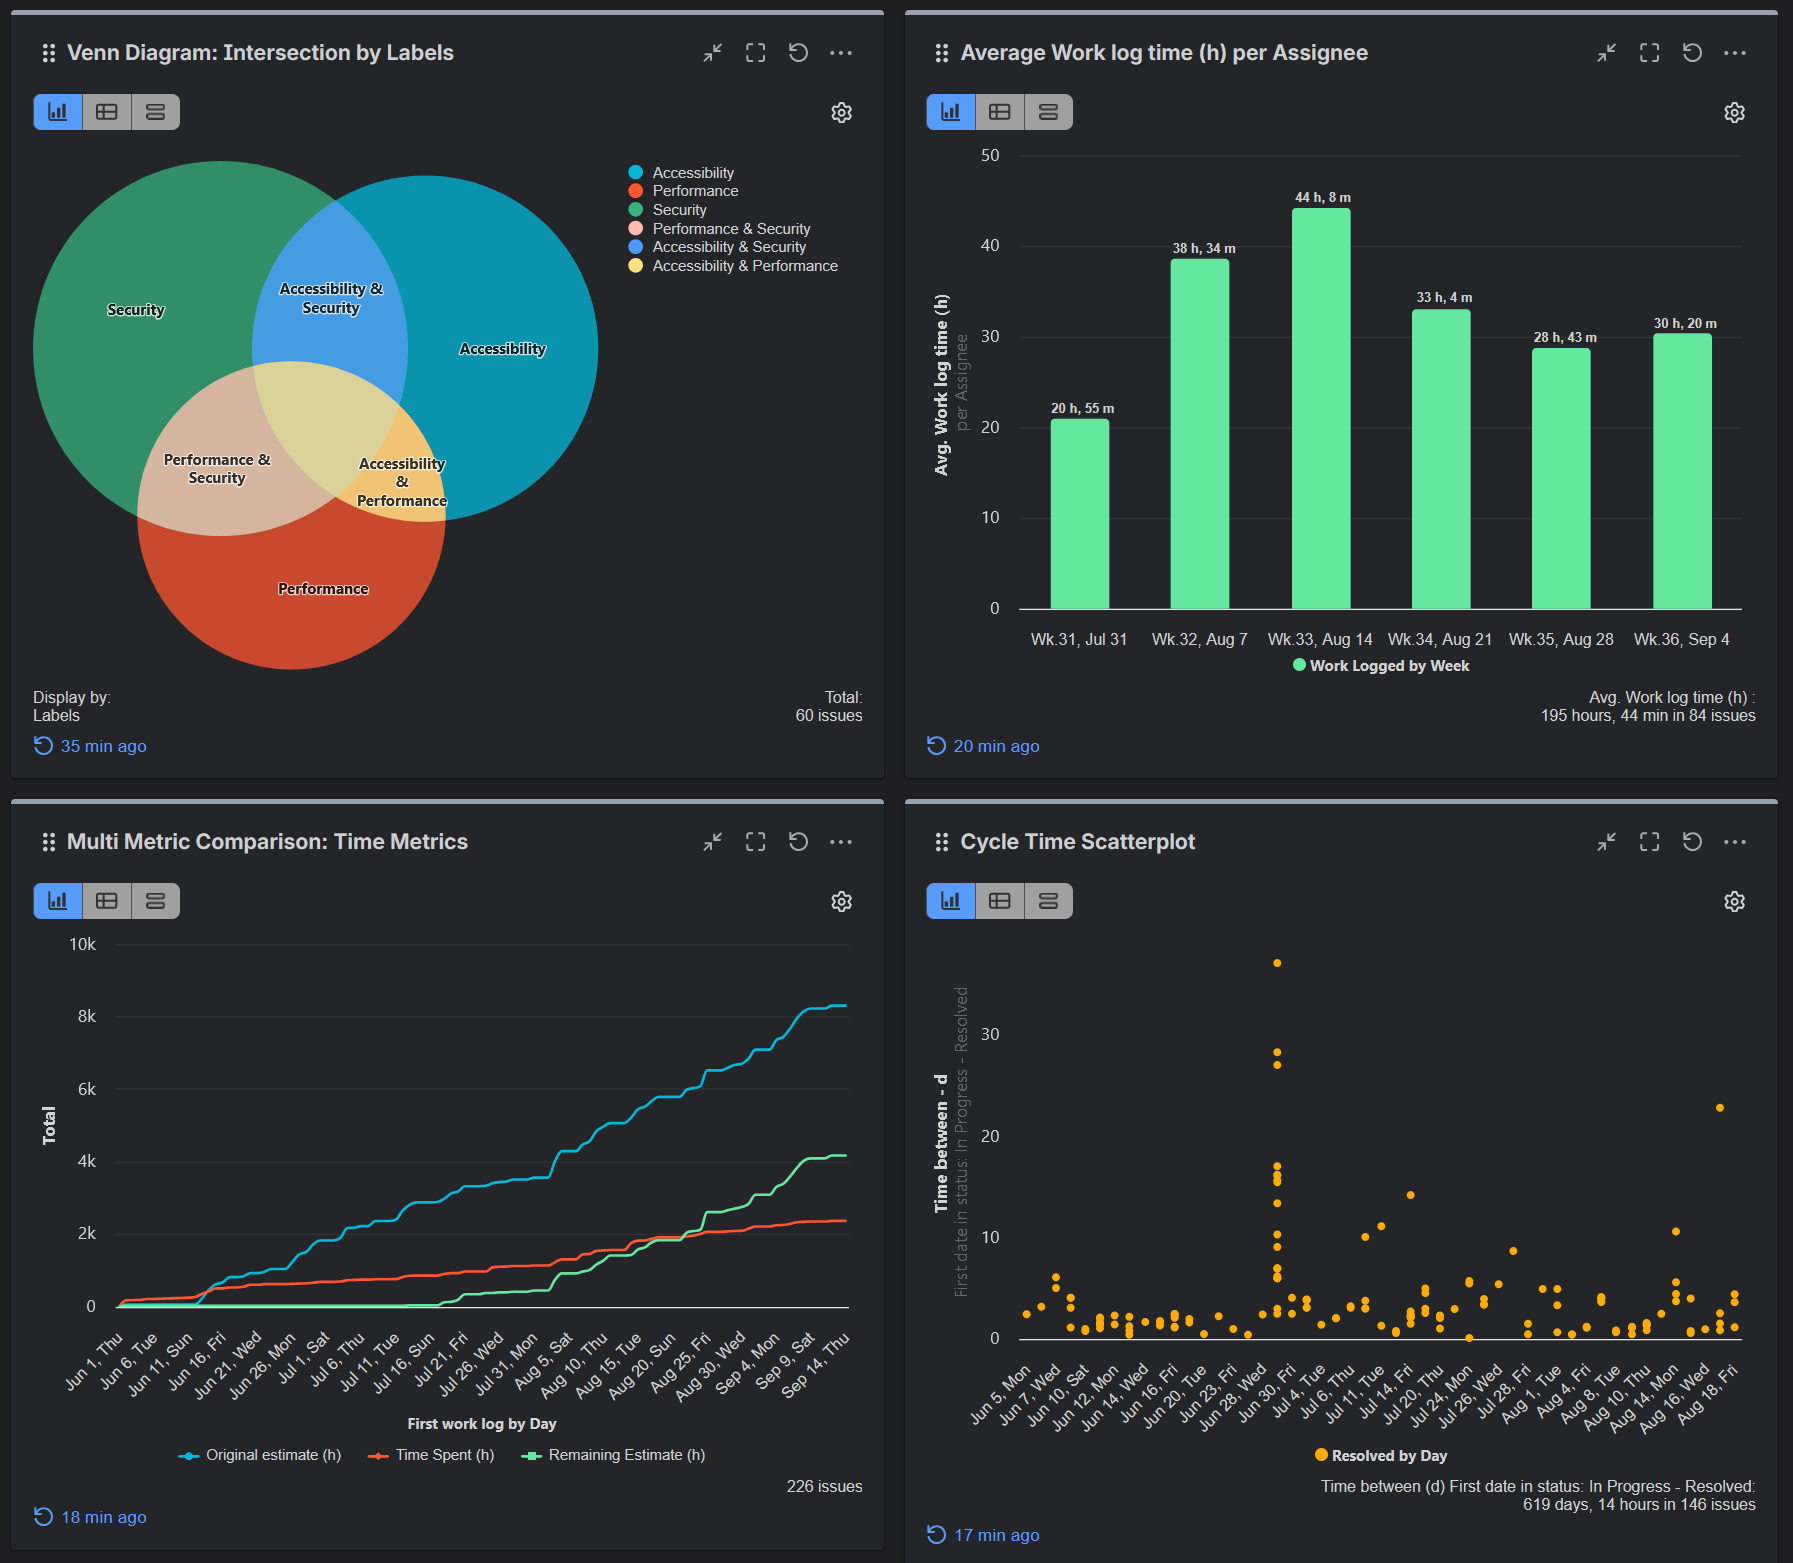
KPIs are unique to each company, as processes and goals differ. Performance Objectives app makes tracking KPIs in Jira easy with a user-friendly setup and flexible customization.
Not focused on KPIs? If you are looking to create simple charts for everyday use, you can do that too.
Choose from 12 chart types and nearly 100 Jira fields to create custom reports for Jira Software, Jira Service Management, and Jira Work Management.

User Activity Timeline & History for Jira
A Visual Timeline of your Team’s Work
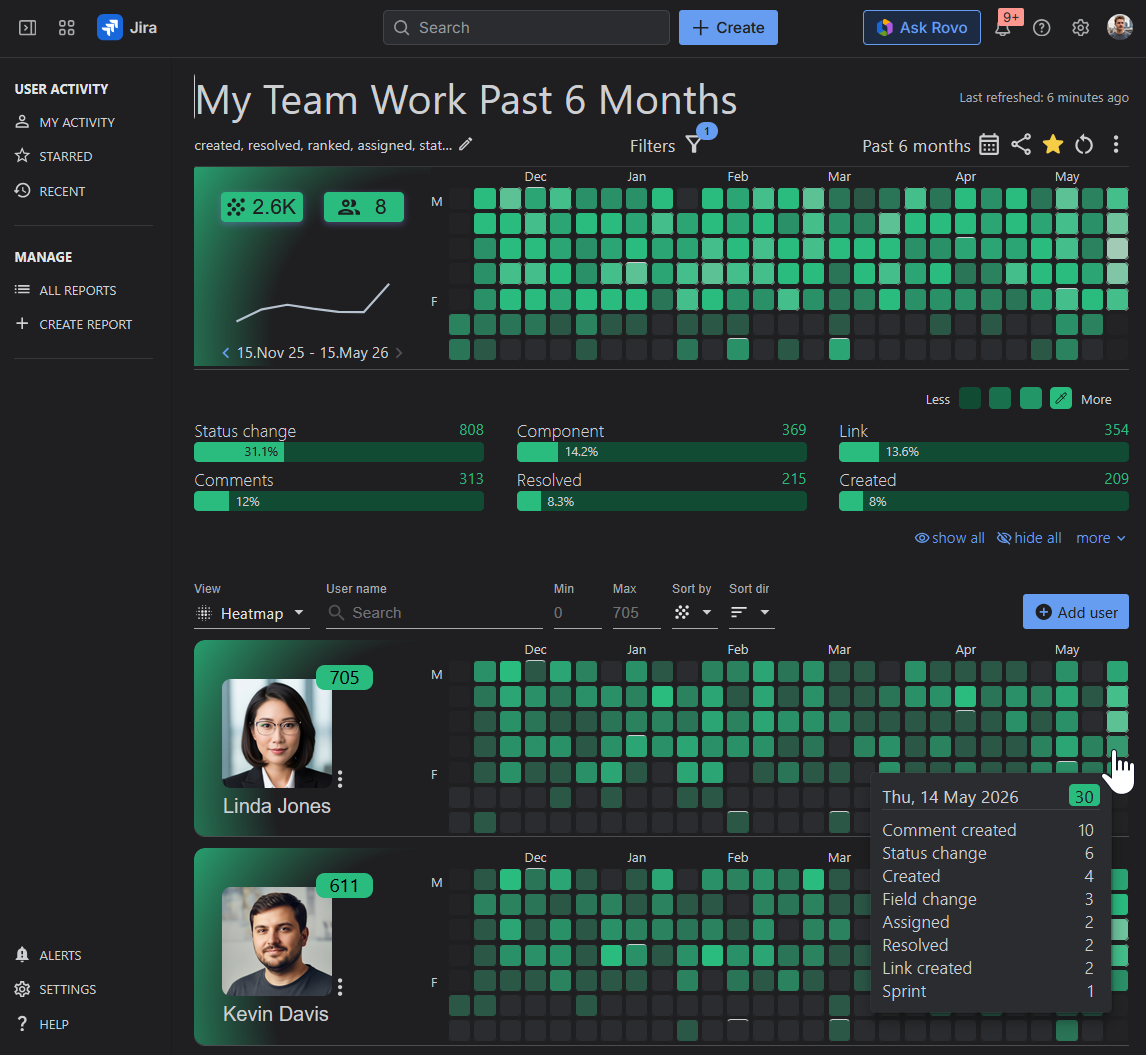
User Activity Timeline app is a visualization and reporting app that transformsfragmented Jira issue history into a clear, calendar-based, user-centric narrative.
Going beyond the issue lists and tables, it provides interactive heatmaps anddetailed activity logs, allowing teams to see exactly how, when, and by whom work is progressing. Create custom issue history reports and gain valuable insights into the activities that matter most to your team.
Start with the My Activity Report – your personal issue history timeline displaying your Jira activity over the last 365 days, making your work instantly searchable. It’s the easiest way to answer questions like ‘What was I working on last Tuesday?’