
Kanban
Use Cases for Jira: KPI & Reports Library
Explore Our Comprehensive Library of Reports for Jira
Generate Actionable KPI Reports in Jira with Ease
Access over 40 ready-to-use metrics and 4 target types to easily create custom reports directly on your Jira dashboard in just a few steps.
Popular Jira Use Cases
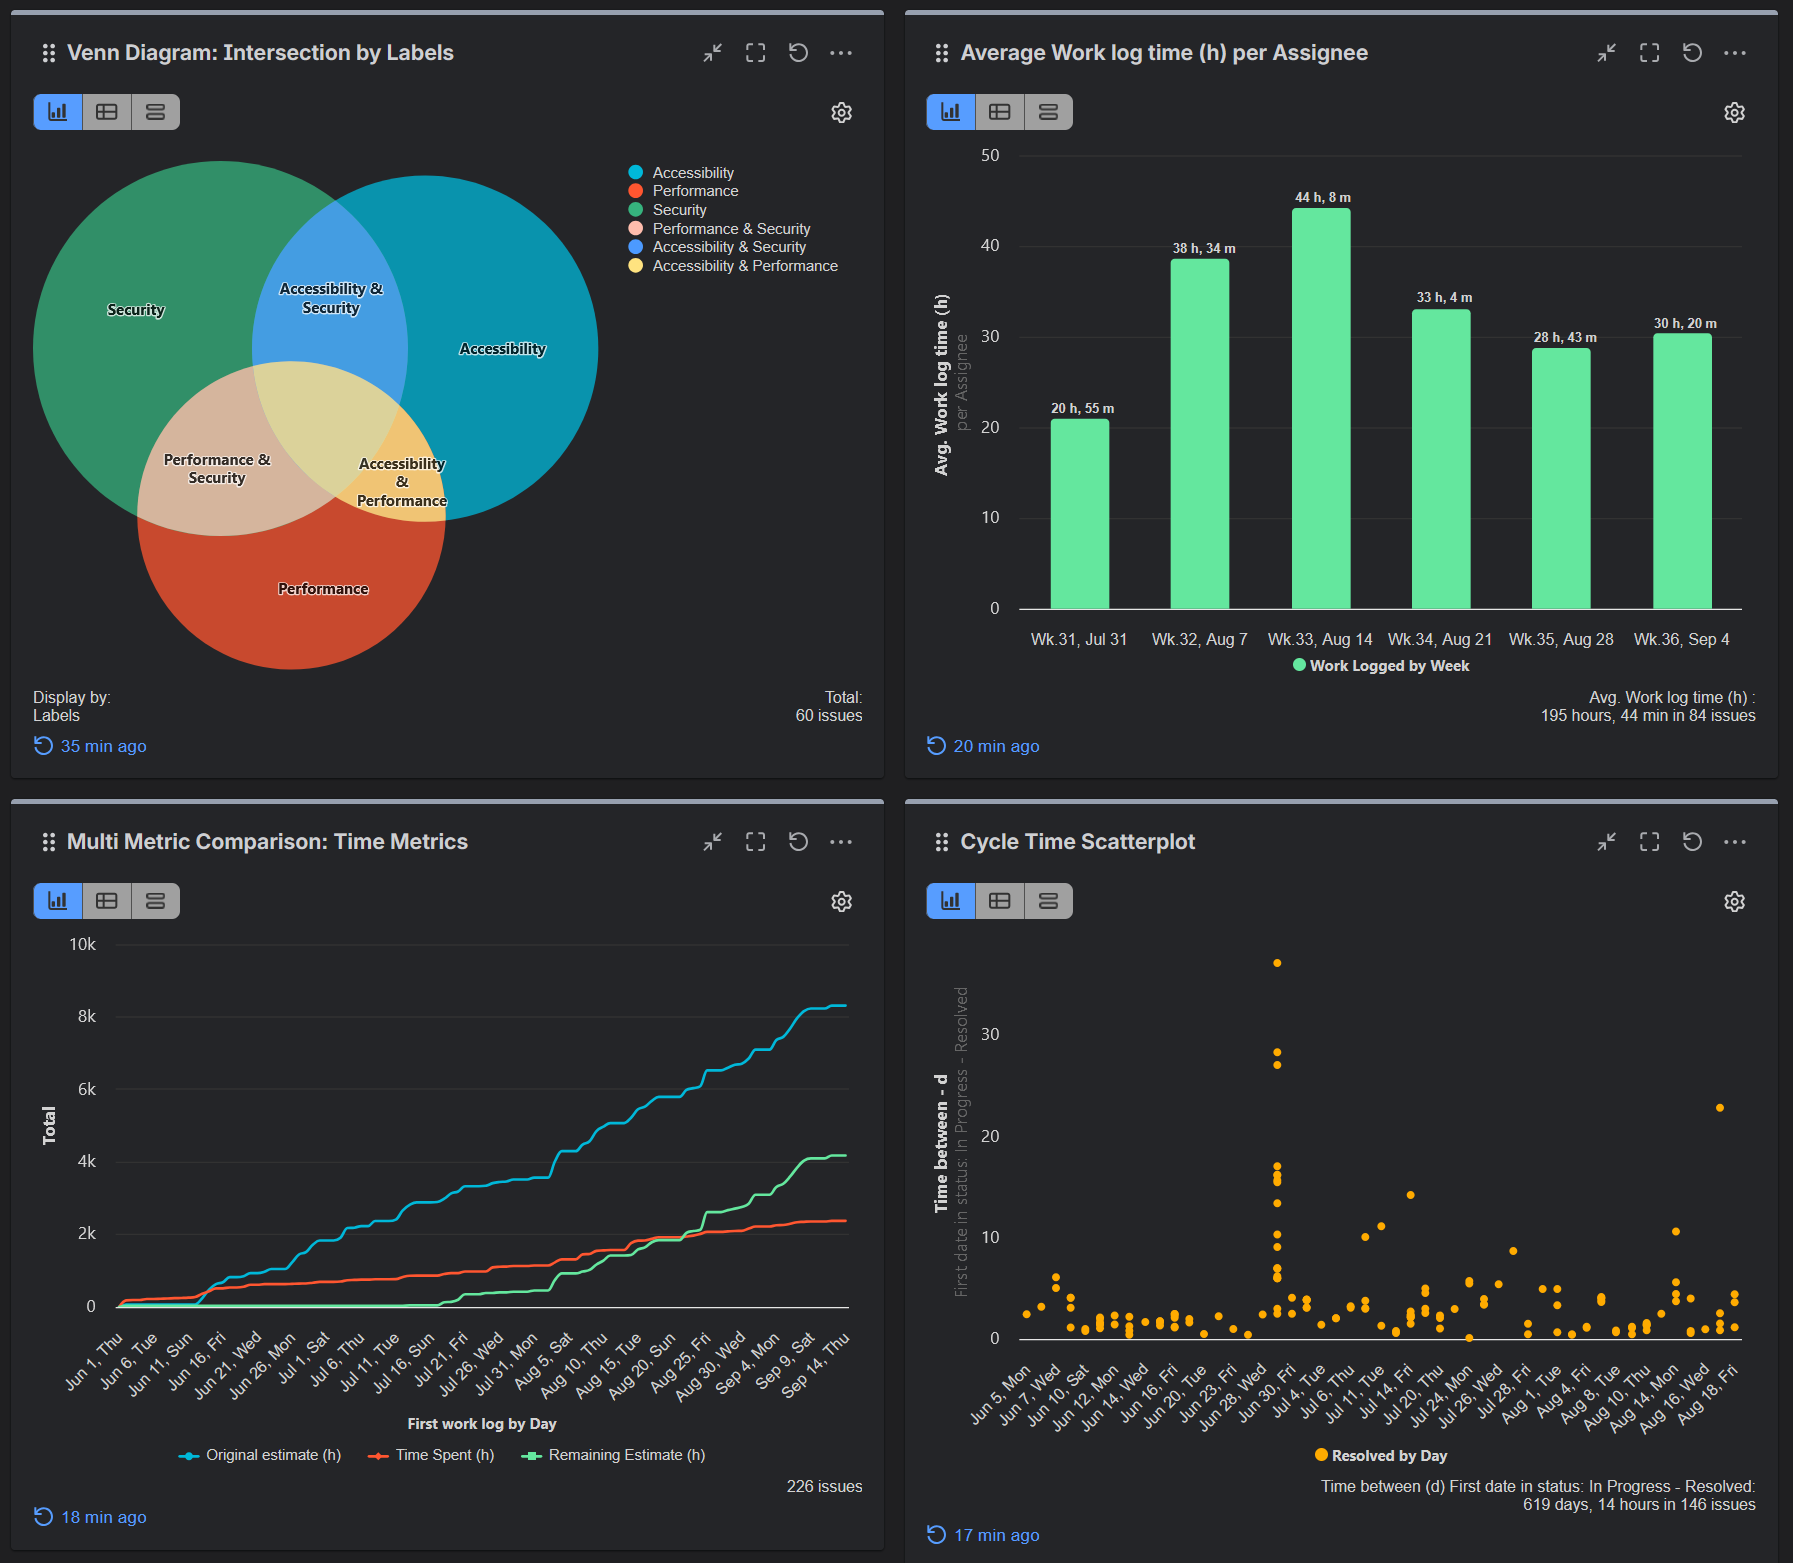
Enhance Every Jira Dashboard
Add custom charts directly on Jira native dashboards.
Choose between 10 gadgets and 12 chart types to create advanced reports for all Jira data that matters to you
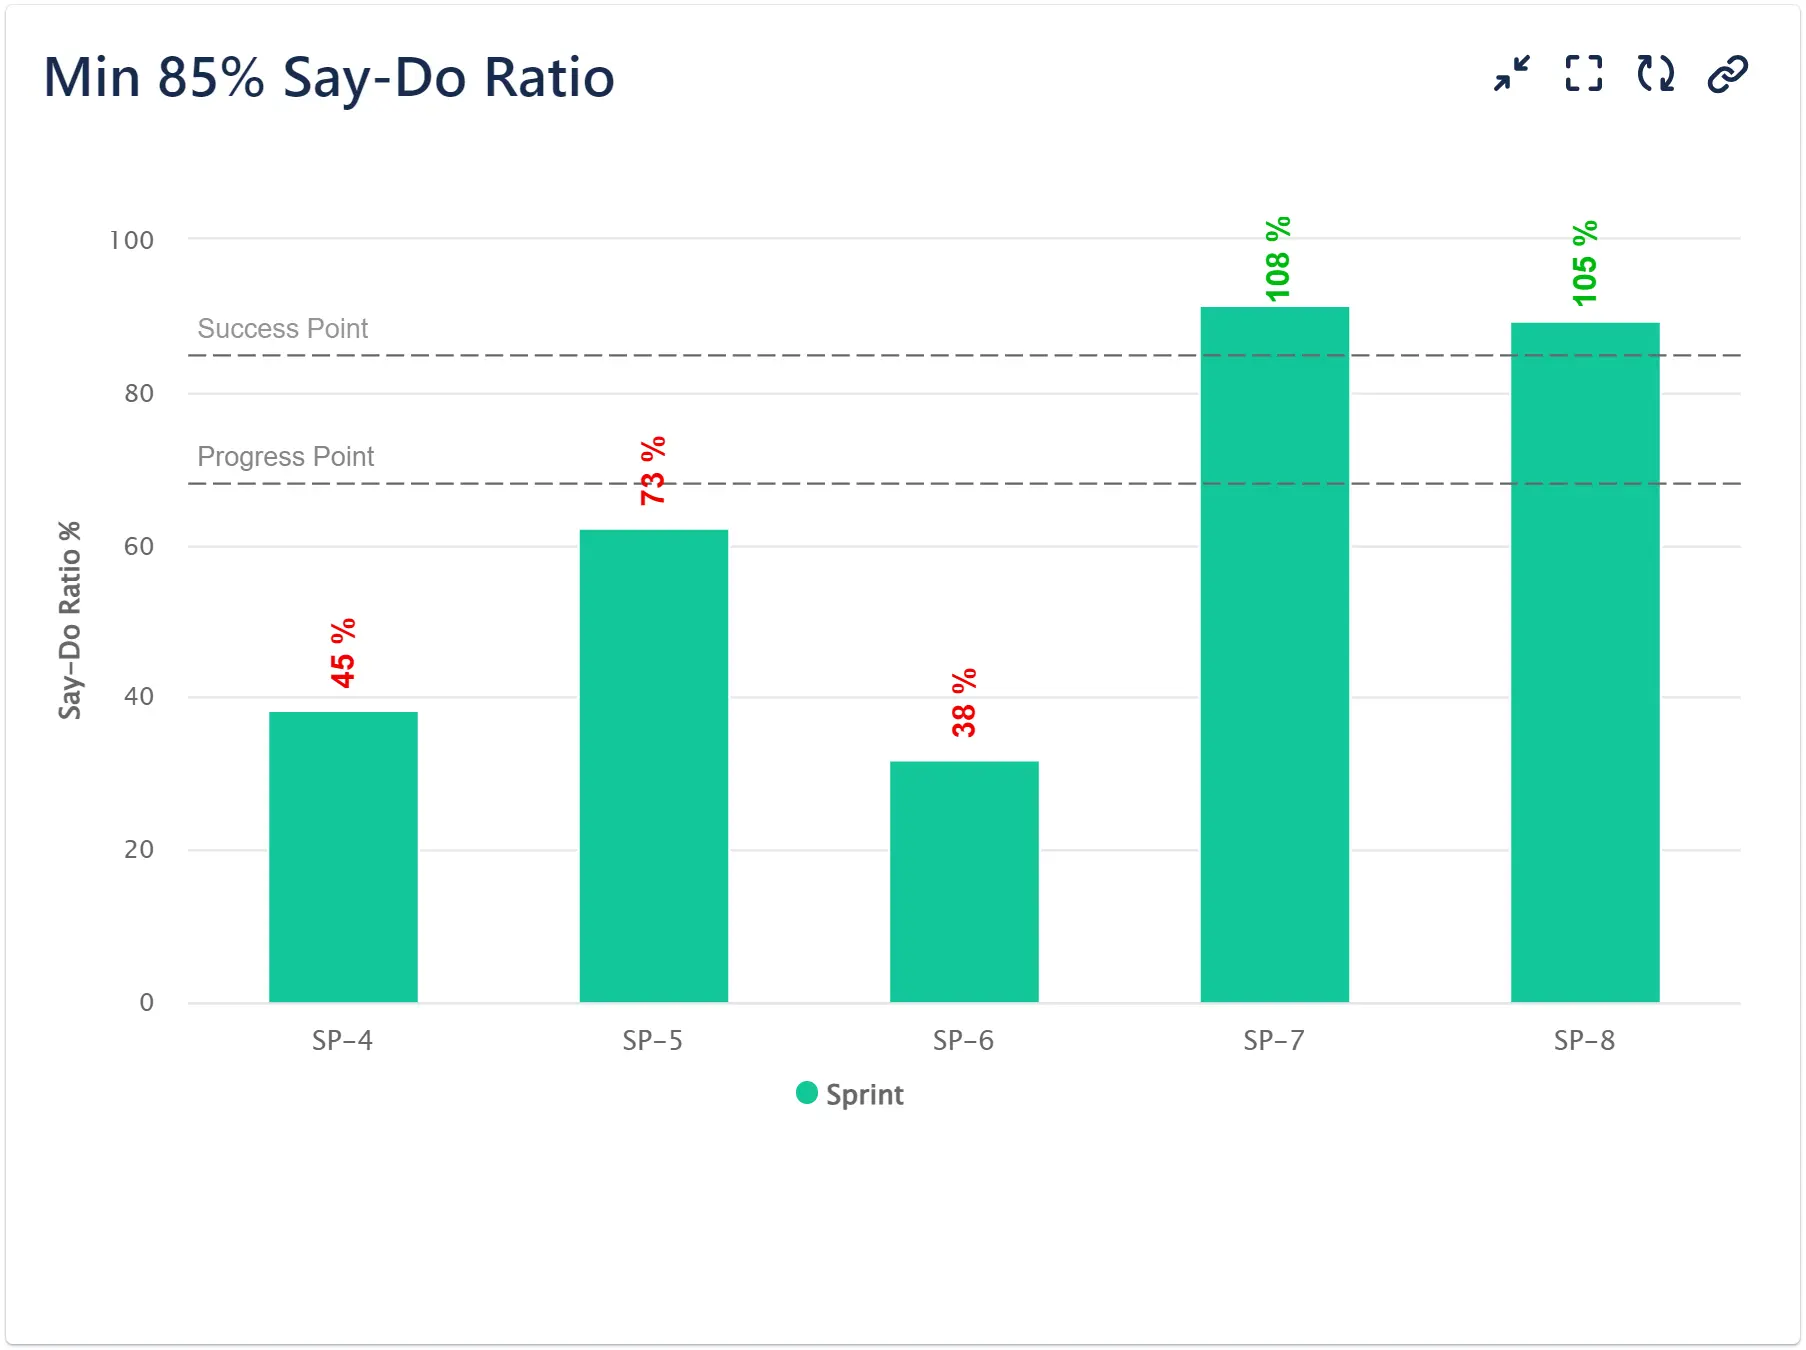
Scrum and Kanban
Agile Reports
Build agile reports in Jira that highlight multi-sprint commitment states, sprint scope changes, spillover patterns, cycle counts, and more!
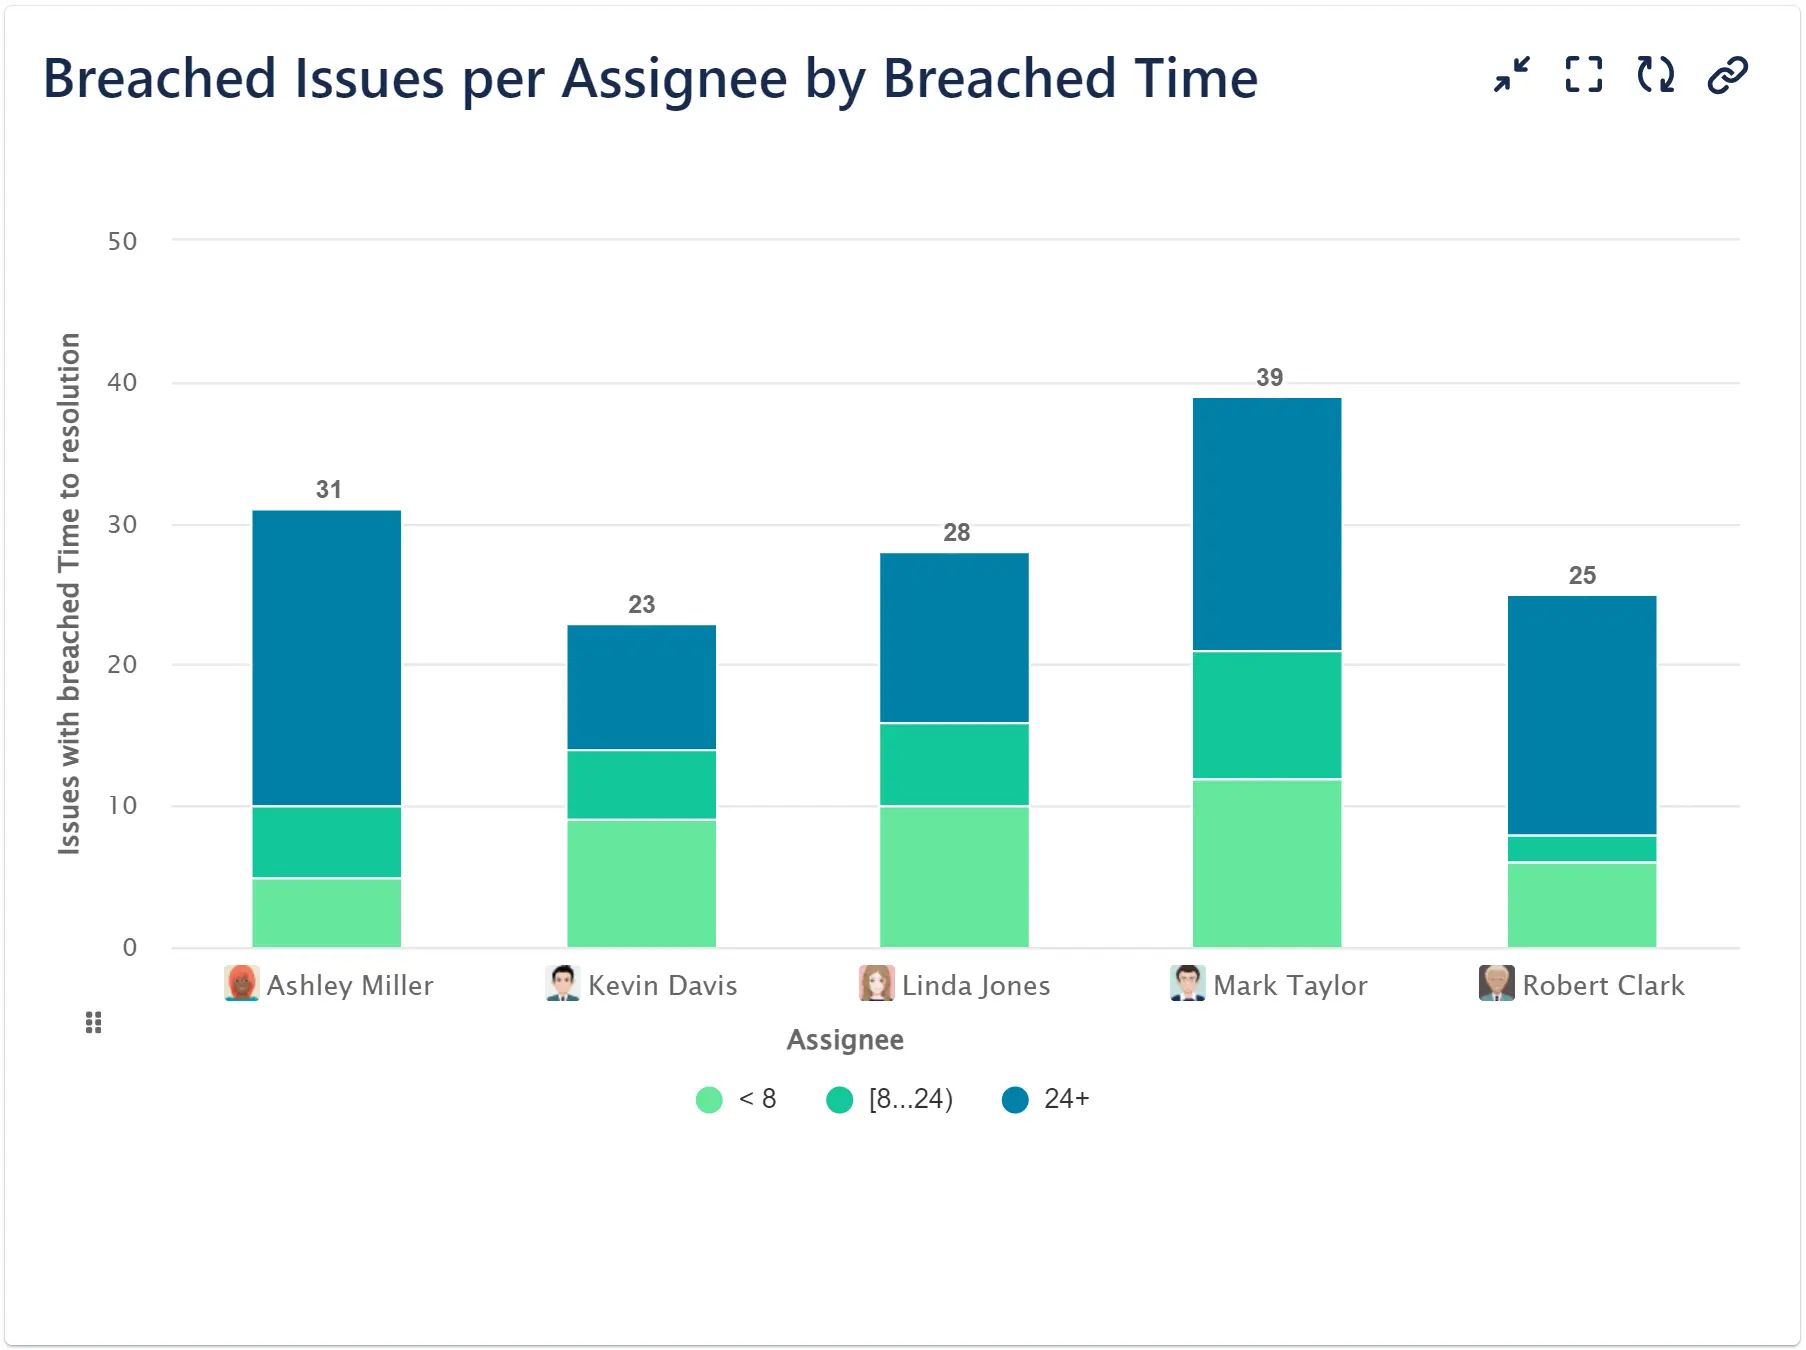
ITSM Reports for JSM
Service Level Insights, SLA, and XLA Reports
Ready-to-Use SLA Metrics: Track Breached or Remaining Time, Open Issues Over Time, Issue Age, Satisfaction, and more!
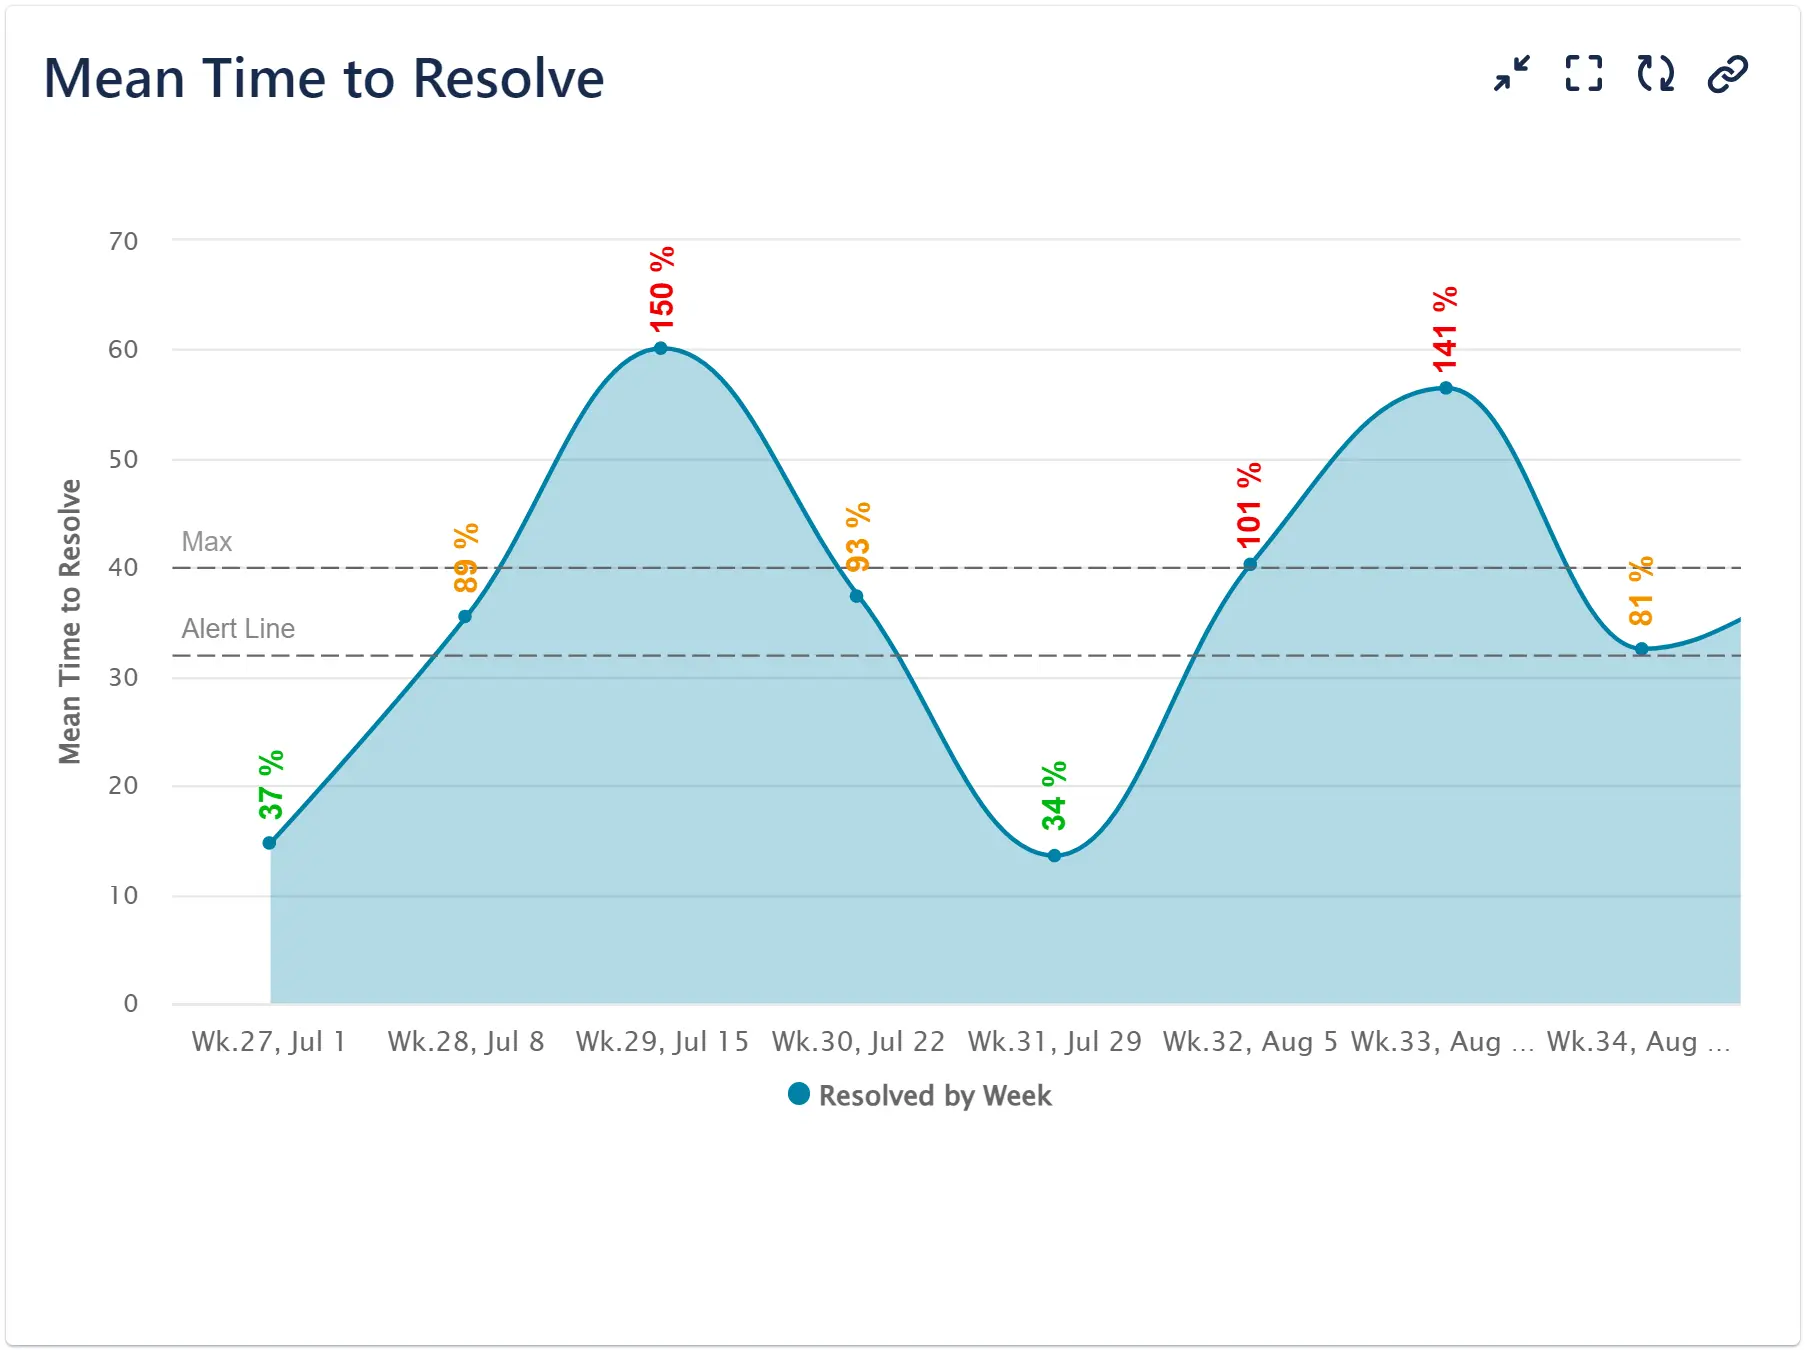
Accurate Time Metrics
Time Reports and Worklogs
Track Time Spent, Time Between or Remaining, Time in Status or Assignee, Worklogs, and More – all in One App!
For Every Jira Team
Period-over-Period, Budget Tracking, Forecasting, and Any Report You Need
Bounce Back, Custom Labels, Reports by Asset Name, and Much More!
KPI & Reports Library
34 reports
- Misc KPI Reports
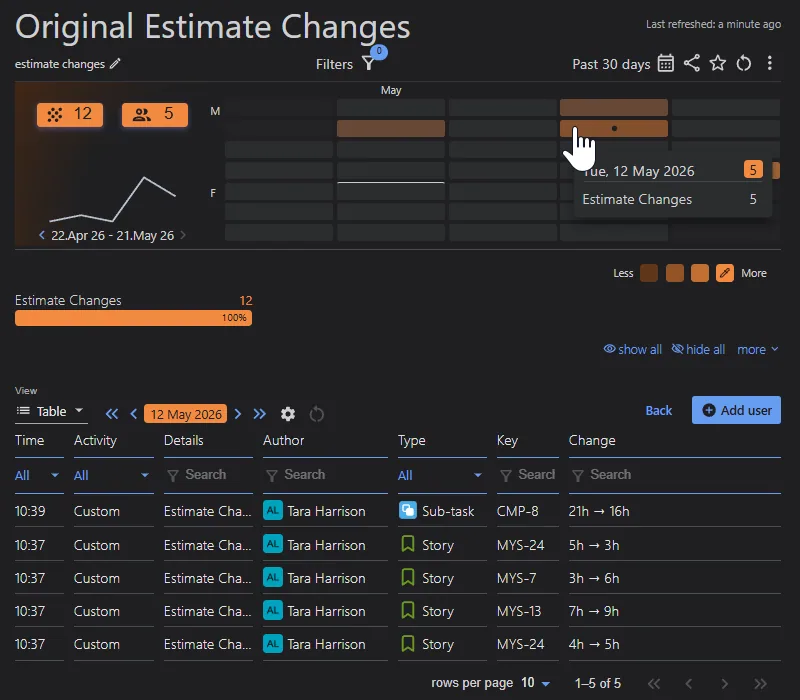
Jira Original Estimate Change History Report
Pull aggregated calendar view report for Jira Original Estimate changes, and provide context beyond what Jira history tab and lists of changes allow
- Misc KPI Reports
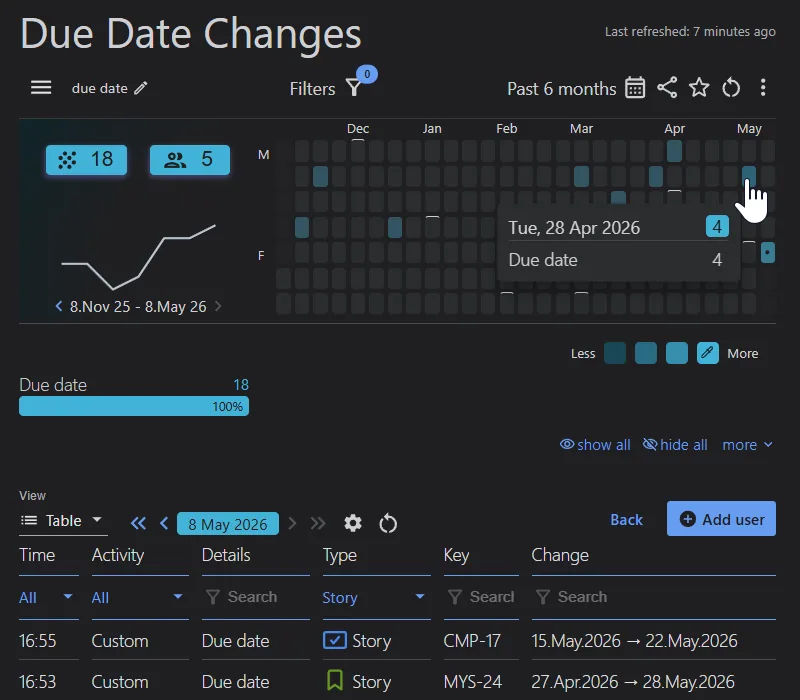
Jira Due Date Change History
See how to pull an aggregated Jira due date change history report, instead of playing detective across individual Jira issue history tabs.
- Service Management
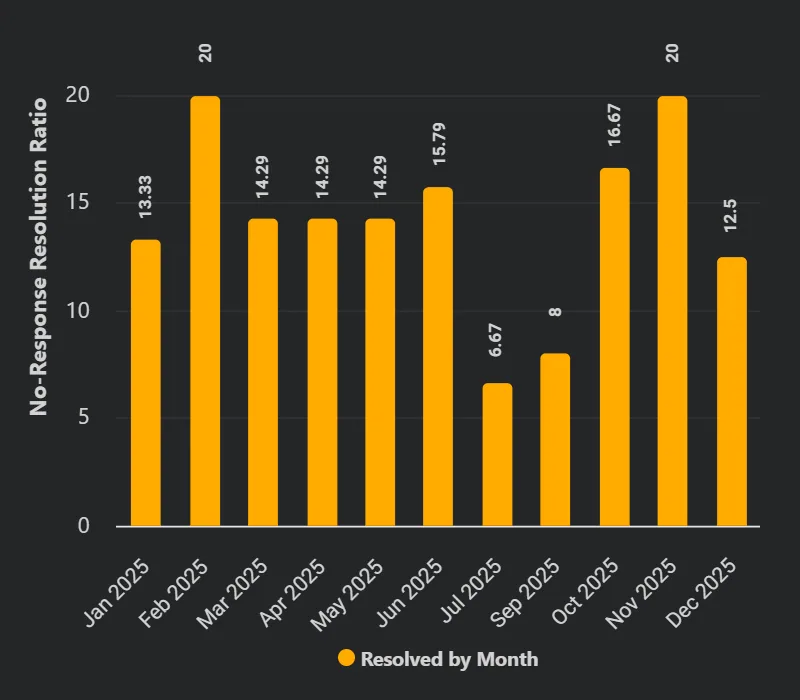
No-Response Resolution Ratio
Configure No-Response Resolution Ratio report in Jira Service Management to track tickets closed due to reporter's inactivity.
- Time Tracking
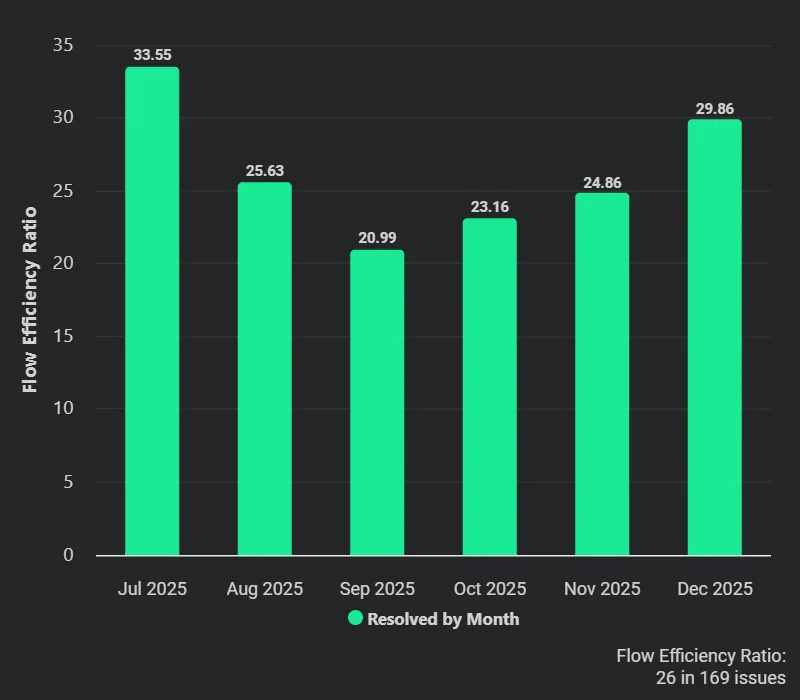
Flow Efficiency Ratio for Jira Kanban Teams
Configure a Flow Efficiency Ratio report on your Jira dashboard to measure active work vs waiting time and identify process bottlenecks.
- Software Development
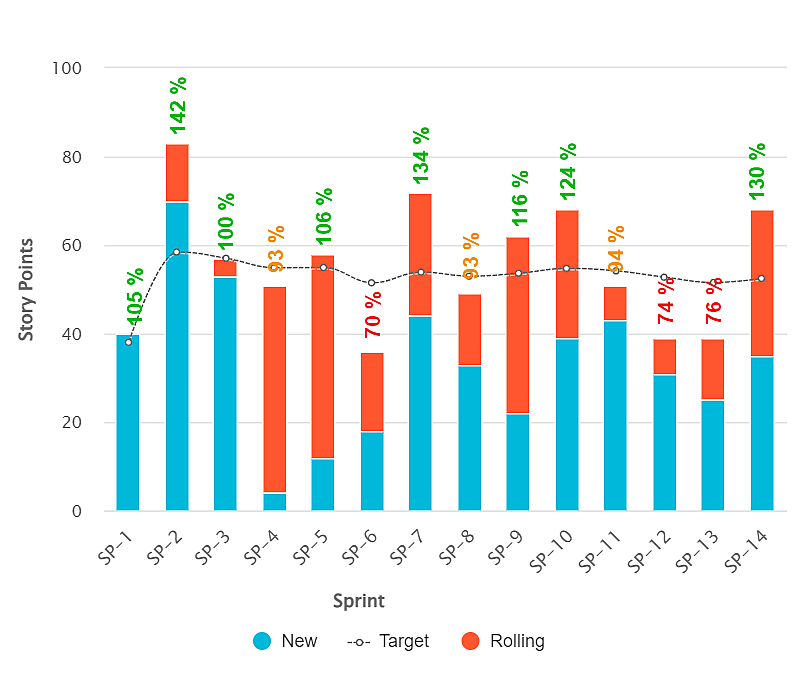
Agile Team Velocity
Configure Team Velocity and Feature Completion Rate reports in Jira with the Performance Objectives app using formulas and targets for sprint insights.
- Misc KPI Reports
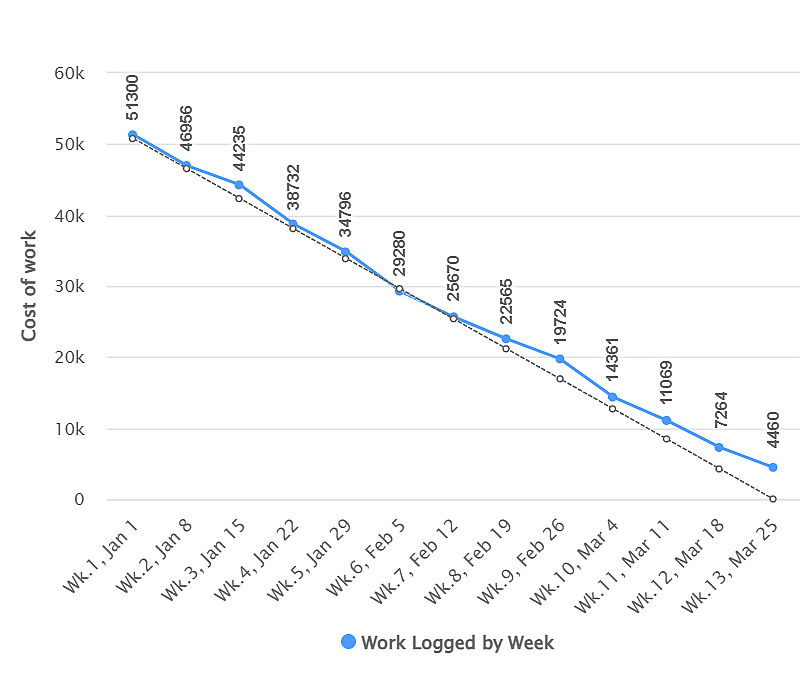
Budget vs Actual Cost Report in Jira
Leverage Formula and Target features for Budget vs Actual cost report in Jira using Performance Objectives: Charts for Jira app.
- Software Development
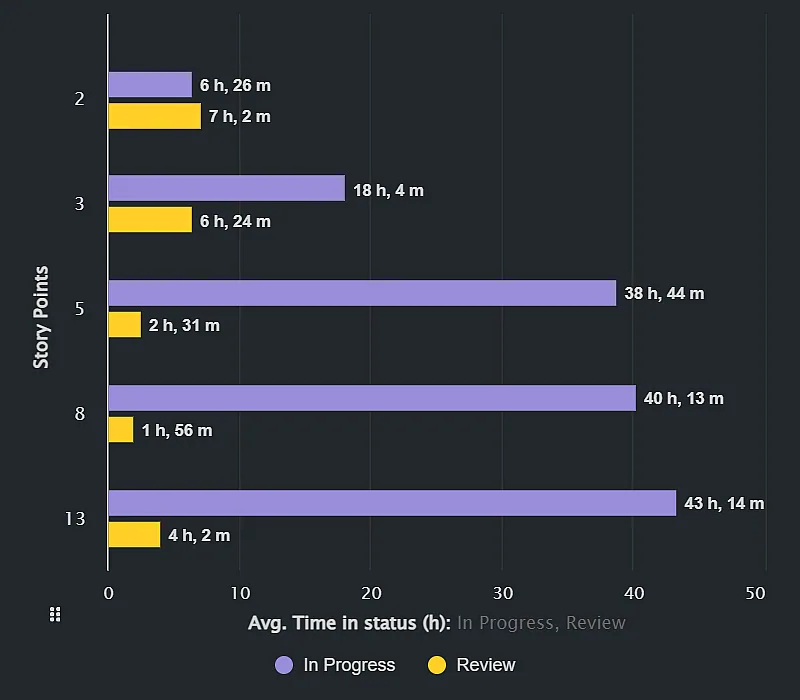
Complexity vs Performance KPI
Analyzing Story Points: Assessing Complexity vs Performance through Average Time in Status with Performance Objectives app.
- Software Development
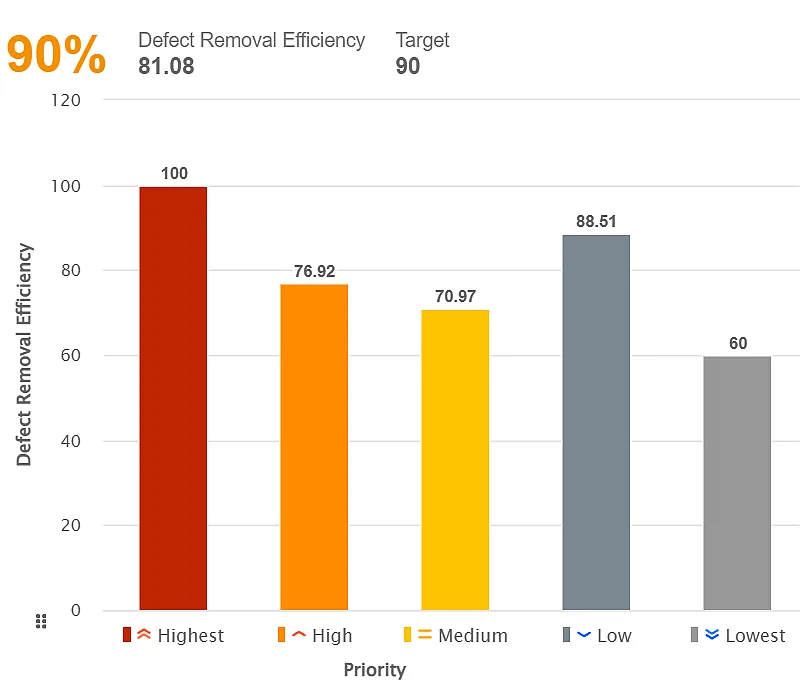
Defect Removal Efficiency (DRE)
Create insightful Defect Removal Efficiency report in Jira to enhance software quality assessment and development processes.
- Software Development
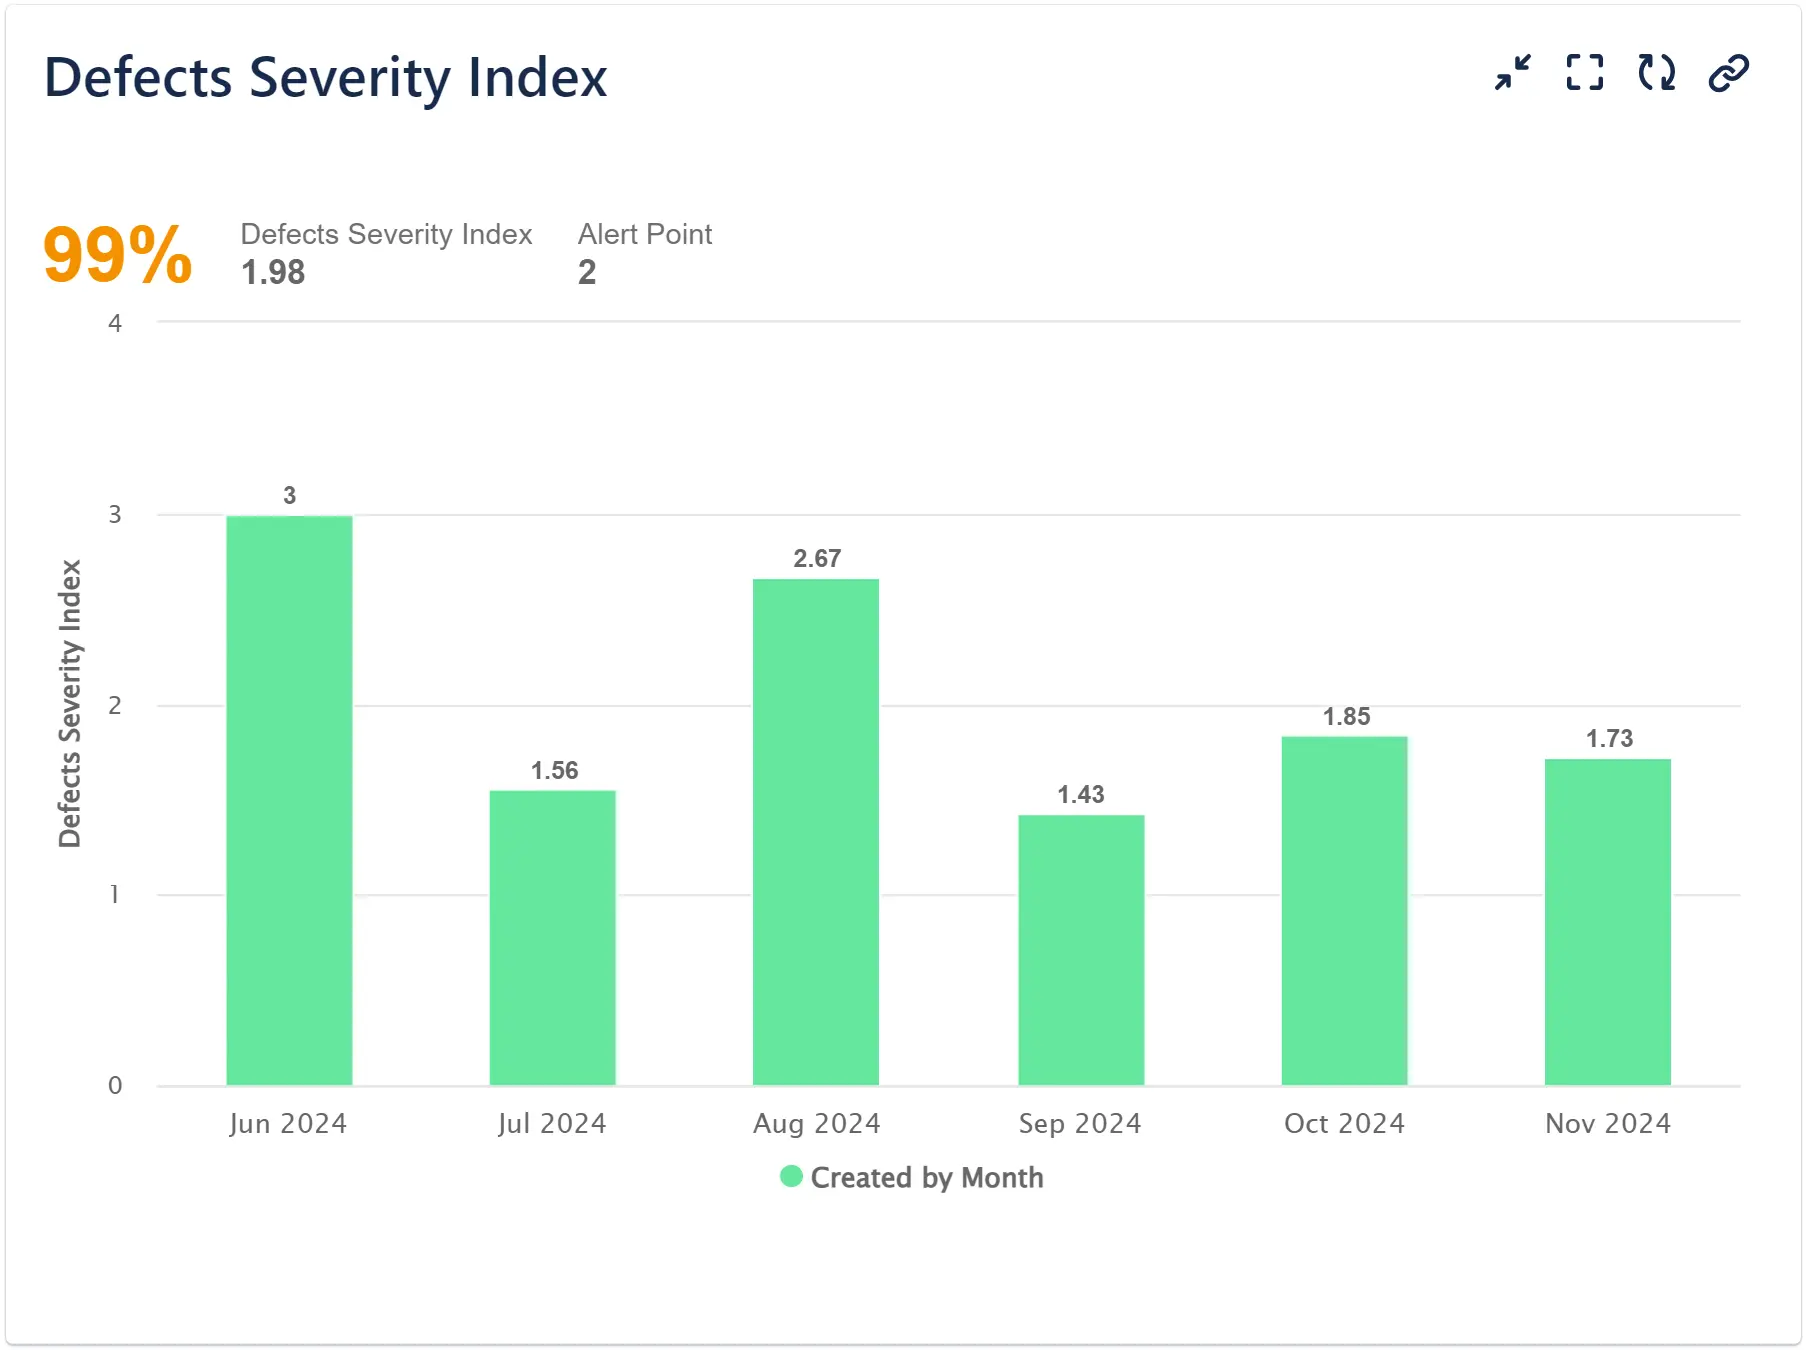
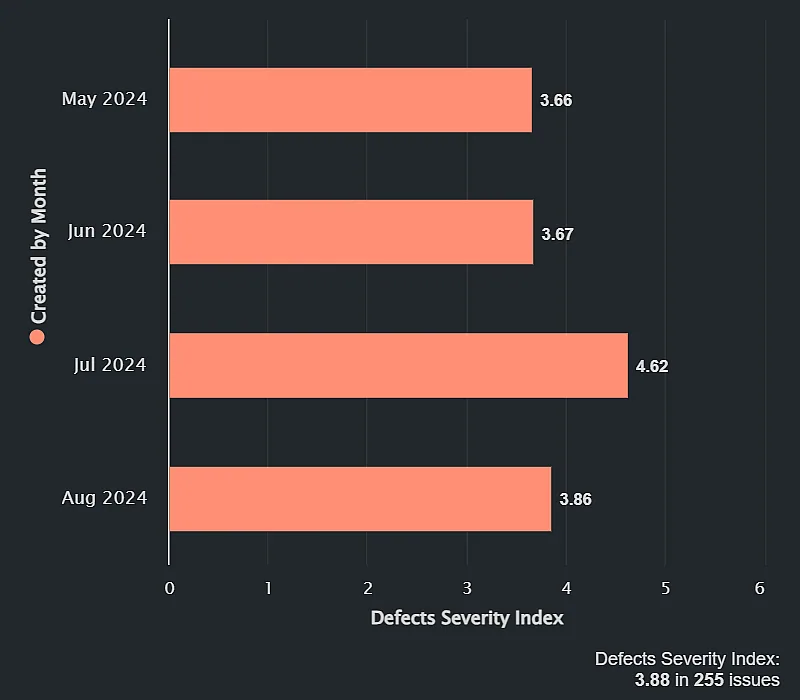
Defects Severity Index
Learn how to create a Defects Severity Index report in Jira with the Performance Objectives app, and leverage QA metrics to enhance your software testing process.
“This app has made it significantly easier to track metrics across multiple teams and compare them on a single chart. Sprint-by-sprint tracking is now faster and more efficient than ever, saving us a considerable amount of time. The support team has been exceptionally responsive and dedicated, always ready to assist with any challenges we’ve encountered.”
“We needed to track sprint health, which the reports built into Jira couldn’t help with. After looking at a few similar add-ons, we went from a manual process involving a spreadsheet to this add-on. The value of Performance Objectives outweighed the value of the others by a fair bit. The customer service has been top-notch, and the documentation has made what could have been a very daunting task a relatively easy one.”
Say Goodbye to Spreadsheets! Set Targets and Track Performance in Real-Time within Jira!
Create insightful reports effortlessly – no hassle, no coding skills required. Go deeper with advanced features like formulas and conditional metrics for comprehensive analysis. Browse our use cases for Jira for insipiration!
Insightful reports
Ease of use
Advanced calculations