Time Tracking
Max Issue Age KPI
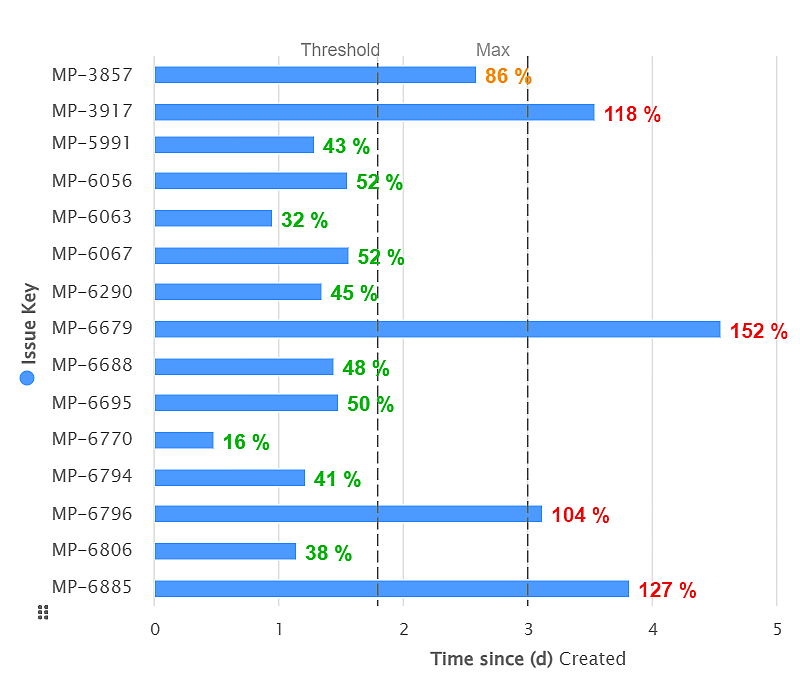
Track time since any standard or custom Jira date field with the Performance Objectives app. Create KPIs such as 'Max issue age'.
Flow Efficiency, also known as Process Cycle Efficiency (PCE) in Lean manufacturing, is a key Kanban metric used to assess how efficiently work moves through a value stream and identify bottlenecks in the delivery process. In this article, we’ll summarize the two approaches to calculating this ratio (operational or product-centered) and will show you how to configure a Flow Efficiency report in Jira using the Performance Objectives app and its flexible feature set.
Kanban teams typically prioritize flow, predictability, and continuous improvement. Flow Efficiency intends to show how much of the Total time is spent on value-adding, active work versus waiting time (time spent in statuses such as Ready for Review, Blocked, On Hold, etc.).
The Flow Efficiency ratio is calculated by dividing Active time by the Total time, then multiplying by 100 to express it as a percentage.
There are multiple valid approaches to defining Total time when calculating Flow Efficiency:
Choose your approach based on whether you want to evaluate overall process efficiency or internal workflow efficiency. You can achieve both with Performance Objectives app.
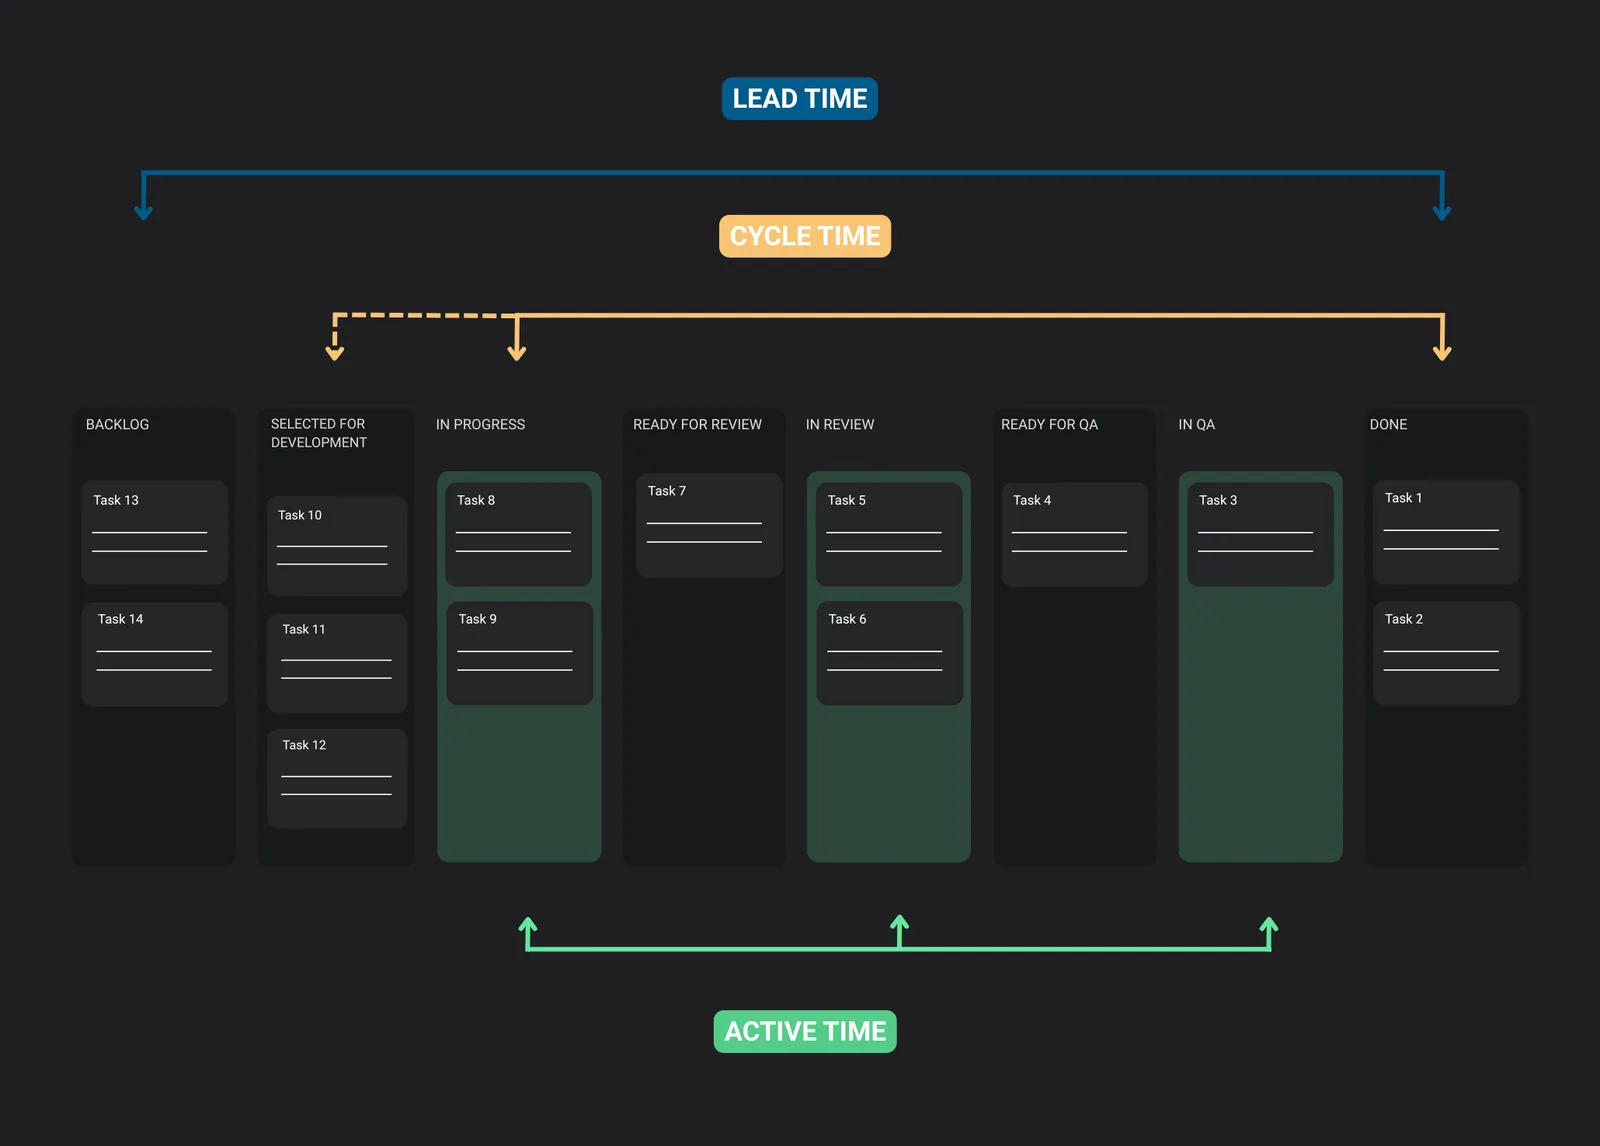
Jira Software’s built-in Kanban reports don’t provide Flow Efficiency as a standalone metric. To monitor this within Atlassian’s tools, you currently need Atlassian Analytics, which is only available on Enterprise plans and includes Flow Efficiency as part of its standard Flow Metrics dashboard. Atlassian defines this metric as ‘the proportion of time that work items are active against their total cycle time‘
If you’re on Jira Standard or Premium plan, the Performance Objectives app allows you to calculate Flow Efficiency Ratio directly on your Jira dashboard. It also offers additional options to customize the calculation:
Among its reporting capabilities, the Performance Objectives app includes a Formula feature, which lets you calculate custom ratios directly on your Jira dashboards. In this example, for Total time we’re using Lead Time (from Created to Resolved), but the app also lets you customize Flow Efficiency to your specific context and needs. You can calculate based on Cycle Time, following the Atlassian Analytics’ approach, filter out low-priority backlog items, or handle other complex scenarios.
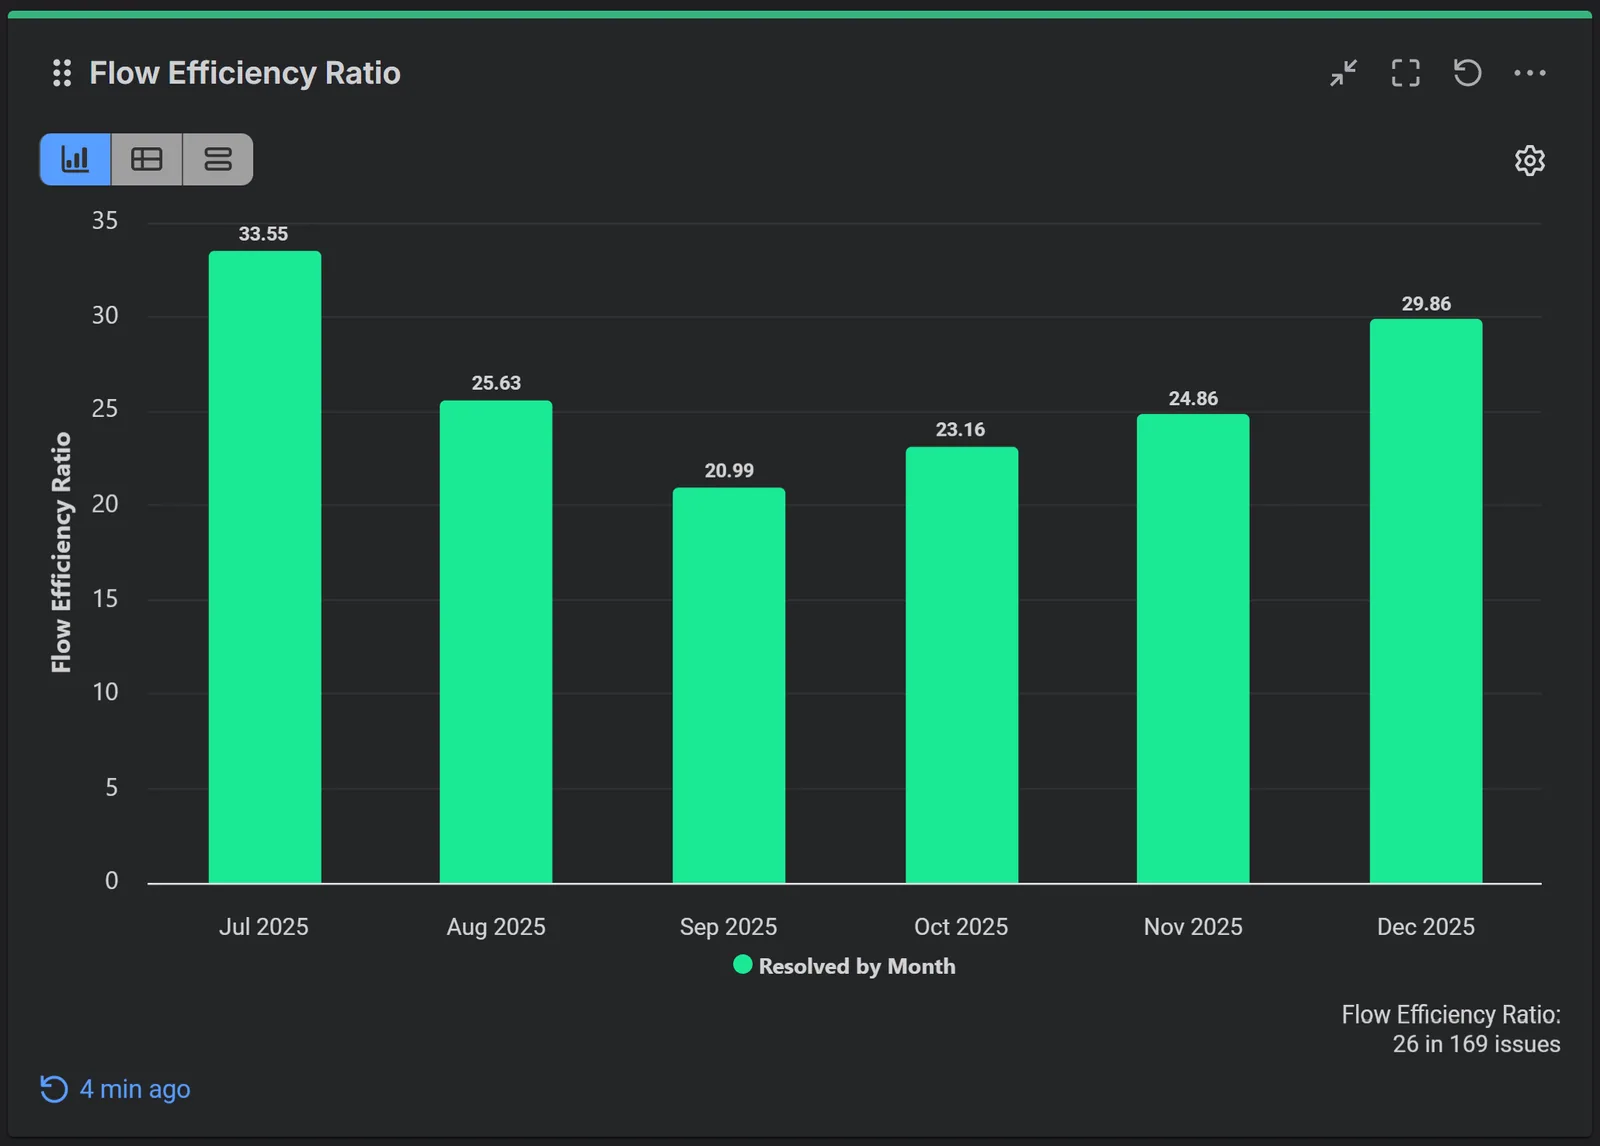
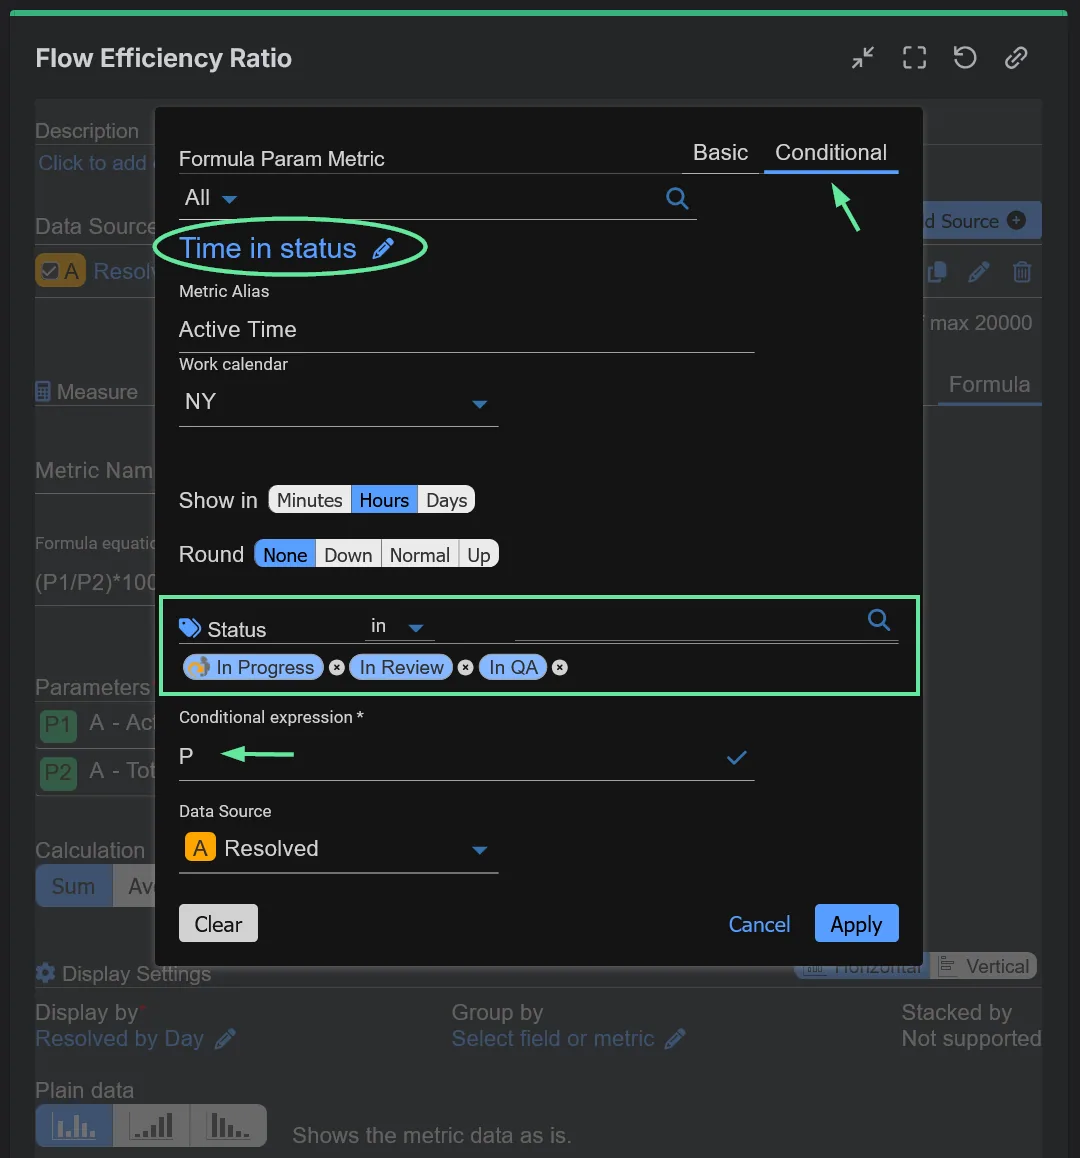
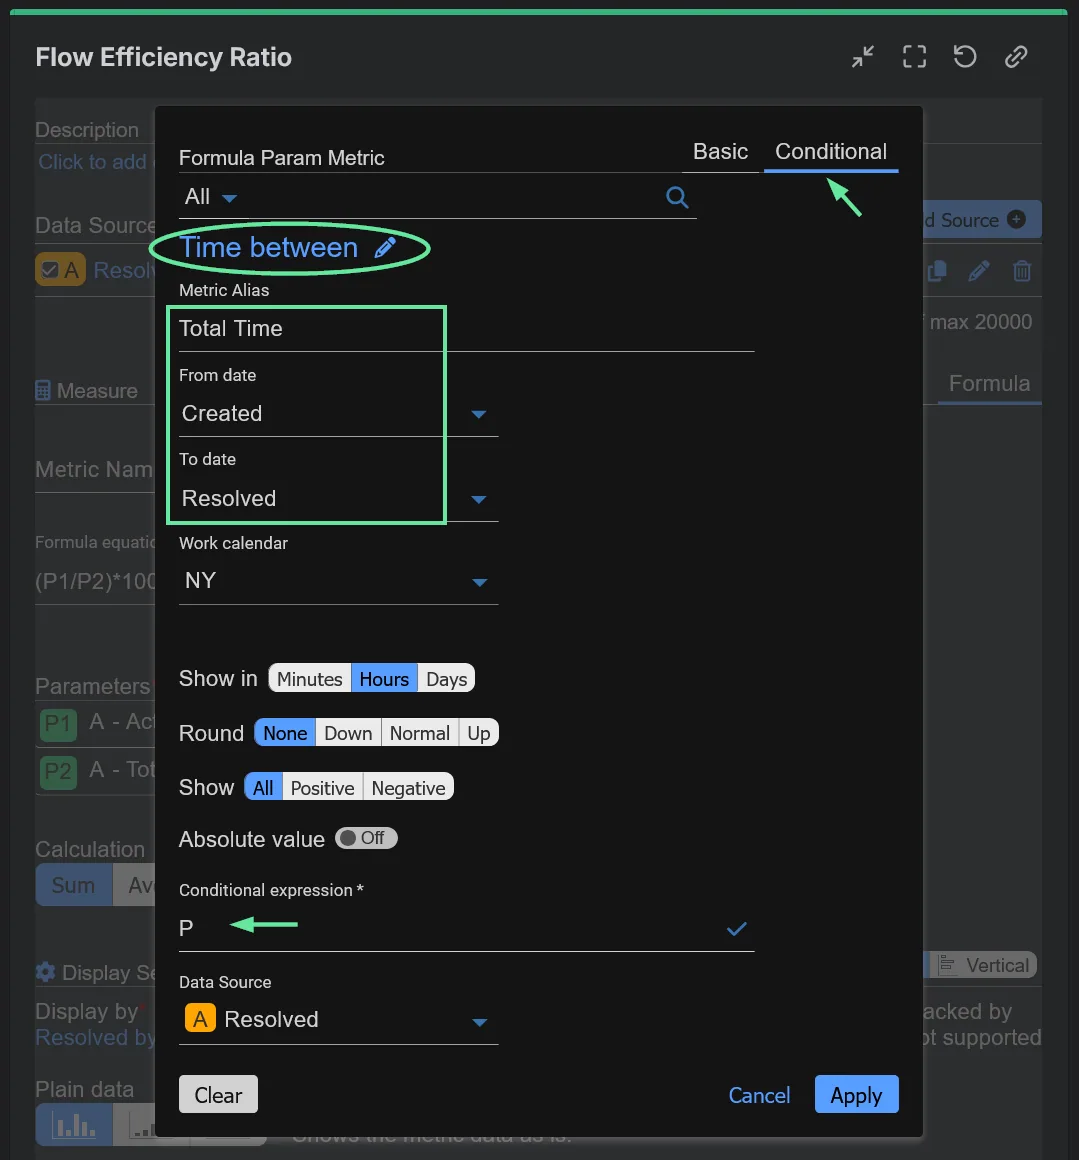
In our sample configuration, we define Active Time using the Time in Status metric, selecting statuses mapped to the ‘In Progress’ category (In Progress, In Review, In QA). For the Total Time parameter, we use Lead Time and the Time Between metric, measuring the total duration from ‘Created’ to ‘Resolved’, to ensure the ratio accurately captures the end-to-end lifecycle of a work item.
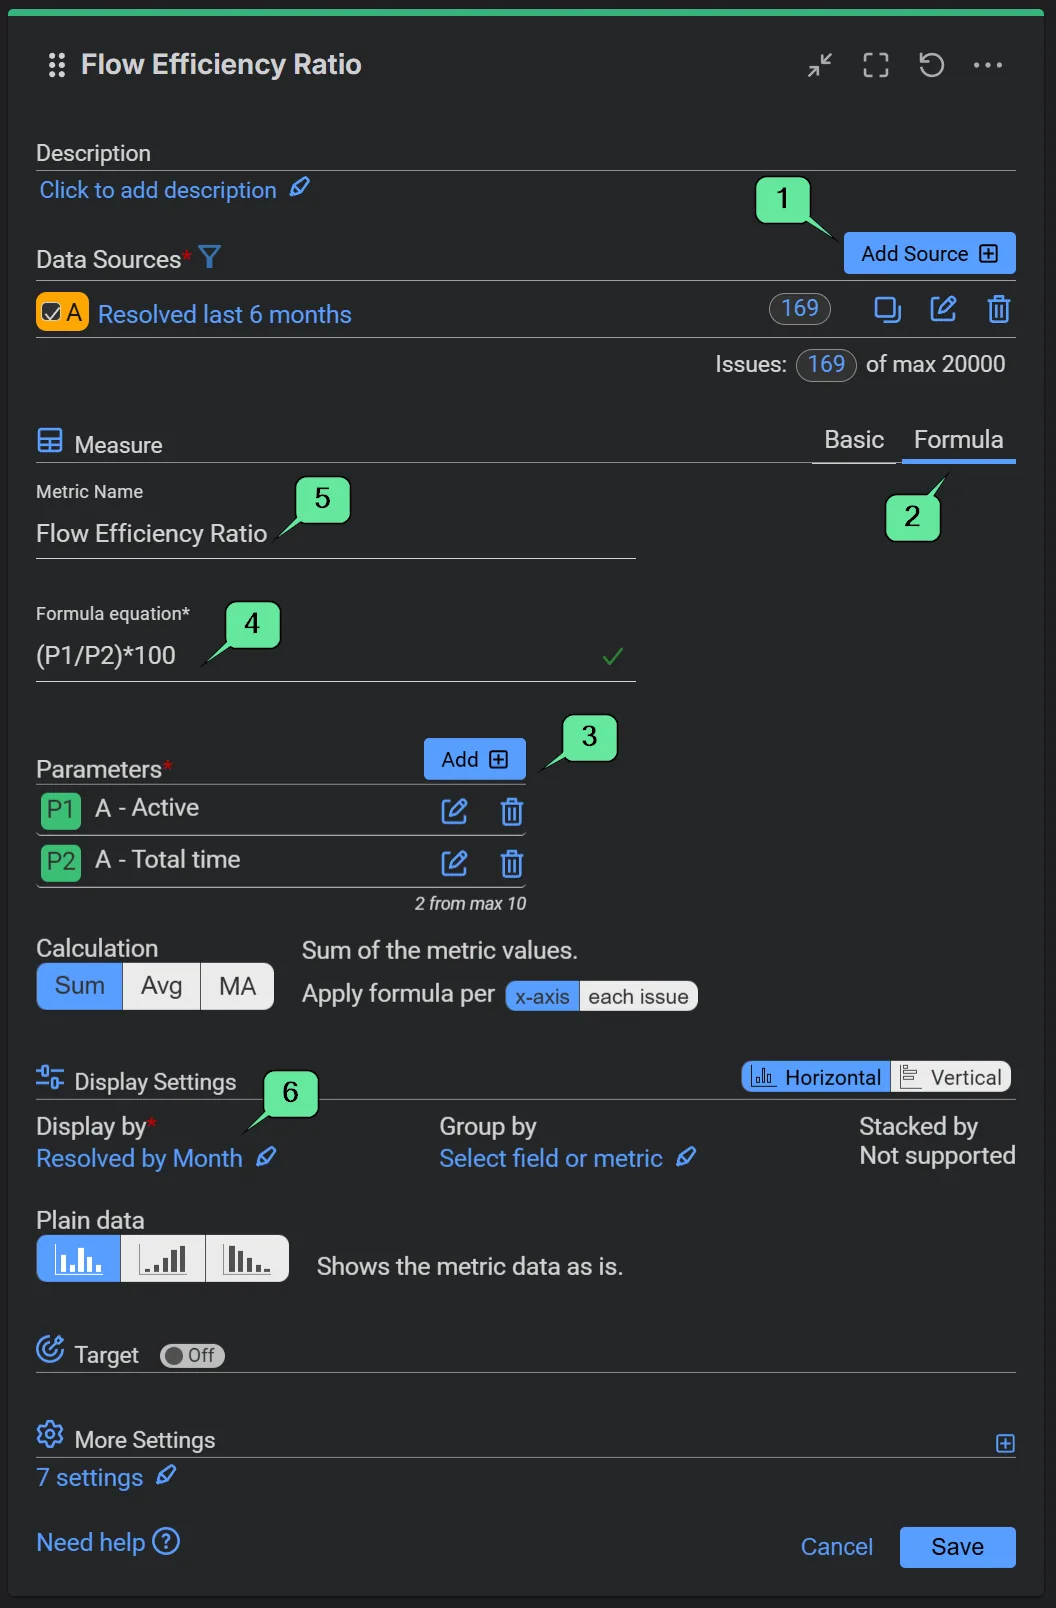
Step 1: In the Data source, filter Resolved issues from your preferred project and time period.
Step 2: Switch from Basic to Formula metric.
Step 3: Add two formula parameters:
For our parameter metrics, we switched from Basic to _Conditional _metrics to assign custom names (Active and Total time). Refer to the detailed images below for more information.
Step 4: Add the formula equation: *(P1/P2)100
Step 5: Optionally, type custom formula name, such as ‘Flow Efficiency Ratio’.
Step 6: Display by the ‘Resolved’ field and pick the preferred granularity – by day, week, month, etc.
Keep in mind that efficiency ratios are highly context-dependent, meaning this report’s primary value lies in helping you understand trends and changes within your own system over time, rather than in comparing results to a global benchmark or an “ideal” number.
This report helps you identify how efficiently work moves through the workflow. However, it is more effective when analyzed alongside other essential Kanban metrics that Jira teams rely on, such as:
With the Performance Objectives app, you can configure KPI reports such as Cycle Time KPI, Lead vs. Cycle Time, and Kanban Throughput report, helping you turn metrics into actionable insights. Explore our KPI examples we’ve prepared to inspire you for your next Jira dashboard, or check this blog article to see other Must-Have Kanban Reports for Jira.
Track time since any standard or custom Jira date field with the Performance Objectives app. Create KPIs such as 'Max issue age'.
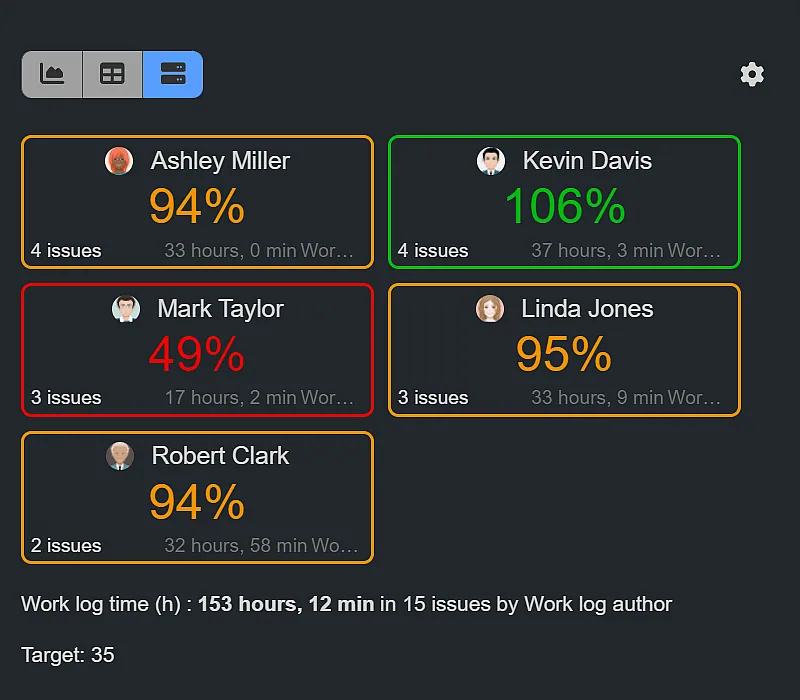
Time Spent by Assignee may yield inaccurate worklog time tracking in Jira. Opt for Worklog Time metric by Work Log Author with Performance Objectives app for precision.
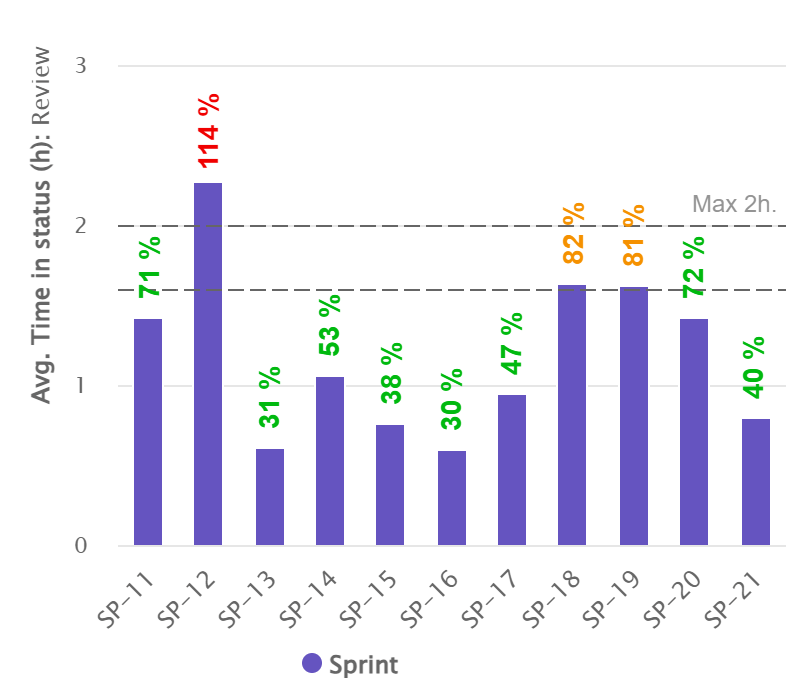
Optimize your sprint performance with Jira KPI reports, analyzing average time in status in sprint. Enhance efficiency and identify bottlenecks effectively.
DevAcrobats develops reporting apps for Jira that extend its capabilities, enabling teams to streamline workflows and enhance performance.
Postal Address:
47A Cherni Vrah Blvd., fl.4-5, Puzl, 1407 Sofia, Bulgaria
Email: office@devacrobats.com