Time Tracking
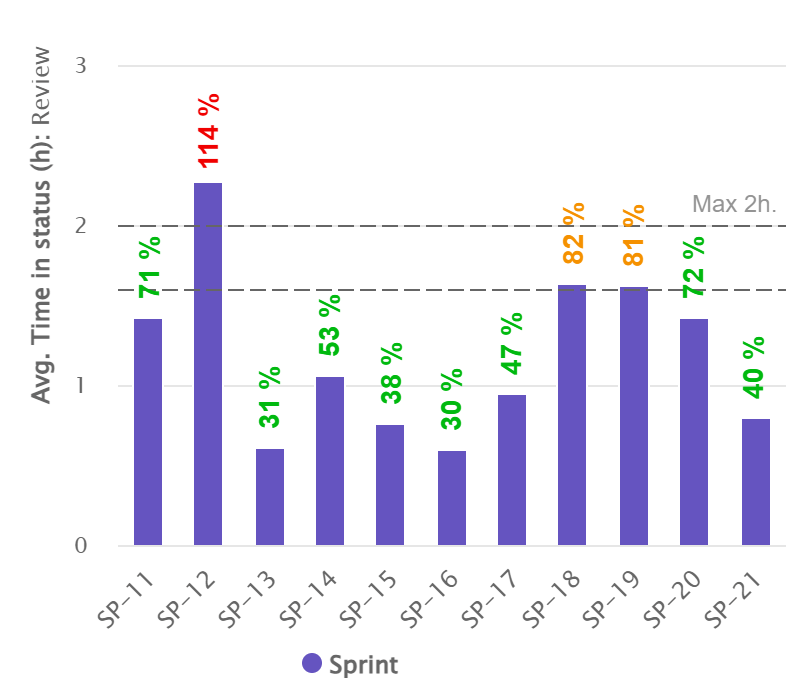
Average Time in Status in Sprint
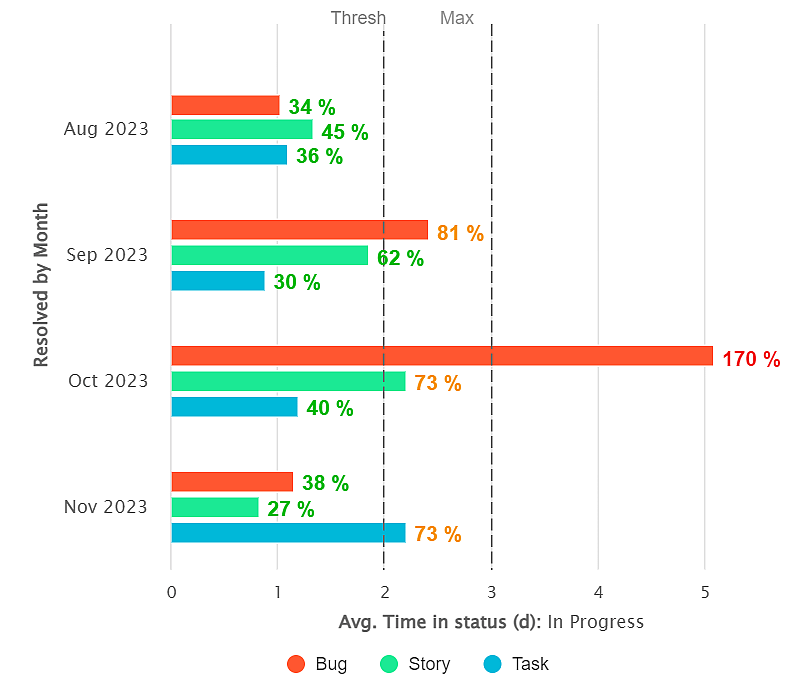
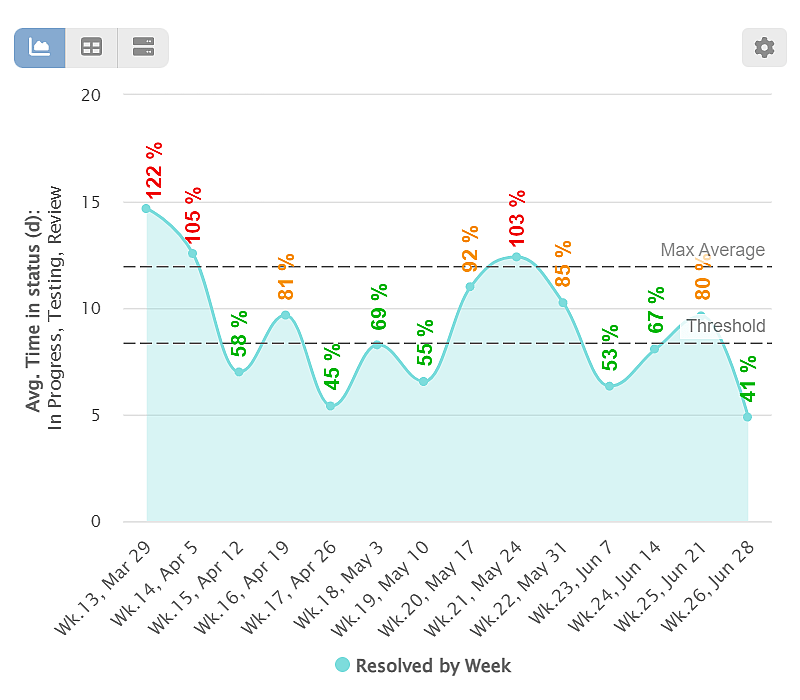
Optimize your sprint performance with Jira KPI reports, analyzing average time in status in sprint. Enhance efficiency and identify bottlenecks effectively.
Explore Our Comprehensive Library of Reports for Jira
Page 3 of 4
34 reports
Optimize your sprint performance with Jira KPI reports, analyzing average time in status in sprint. Enhance efficiency and identify bottlenecks effectively.
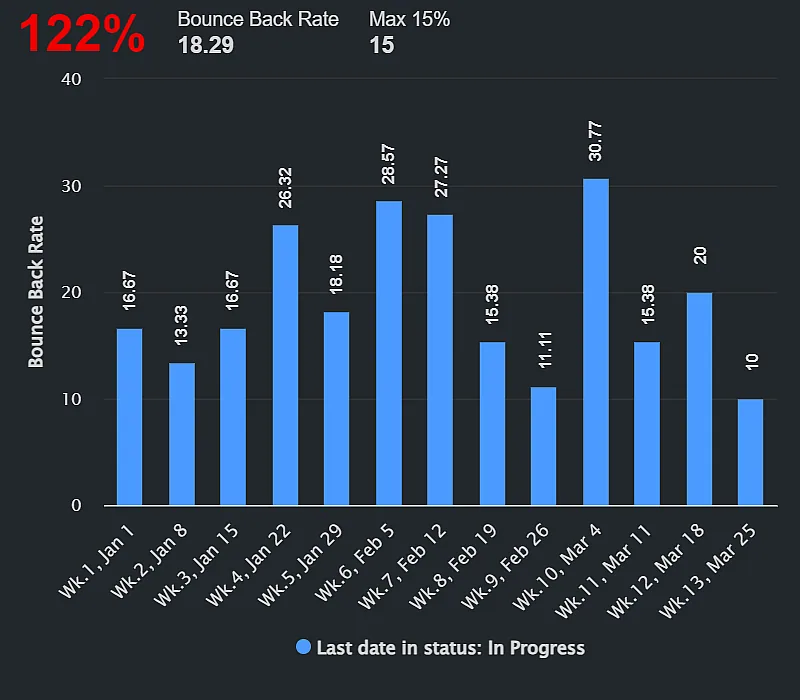
Configure a Bounce Back Rate report in Jira using the Performance Objectives app. Monitor this KPI from your Jira dashboard to optimize workflow and improve project efficiency.
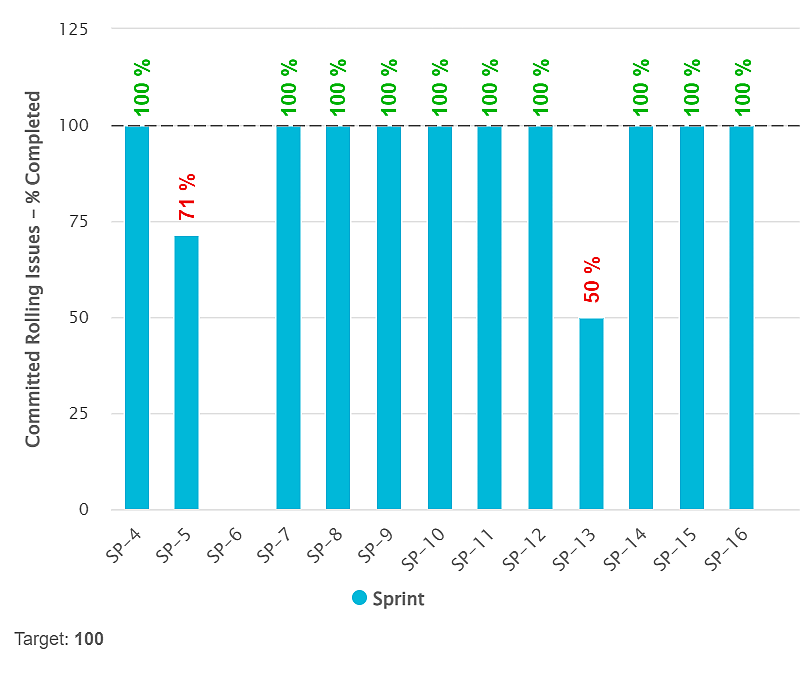
Track how many Committed Rolling Issues are Completed in sprint with the Performance Objectives for Jira app by combining sprint metrics criteria.
Use Performance Objectives app for Jira Cycle Time reports, leveraging Time in Status metric for actionable insights and process enhancements
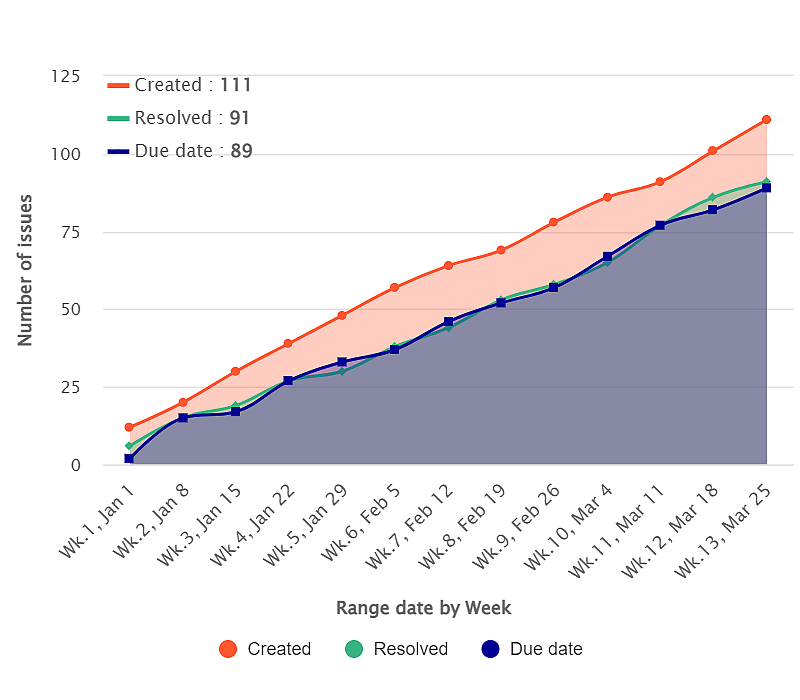
Explore correlation between any date events stored as fields in Jira issues. Build Created vs Resolved report and expand it with other date events
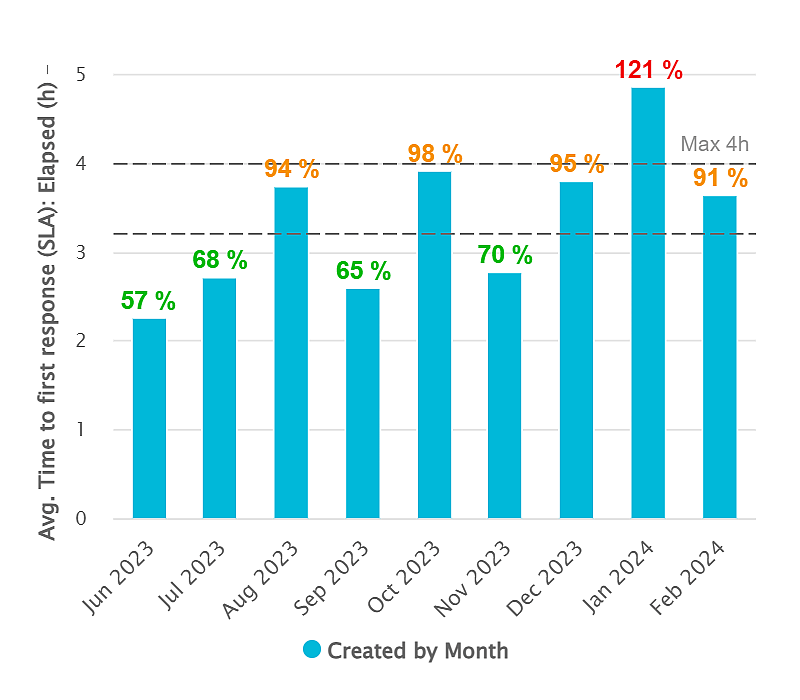
Create a highly customizable First Response Time report in Jira with the Performance Objectives app. Use the Target feature to visualize progress.
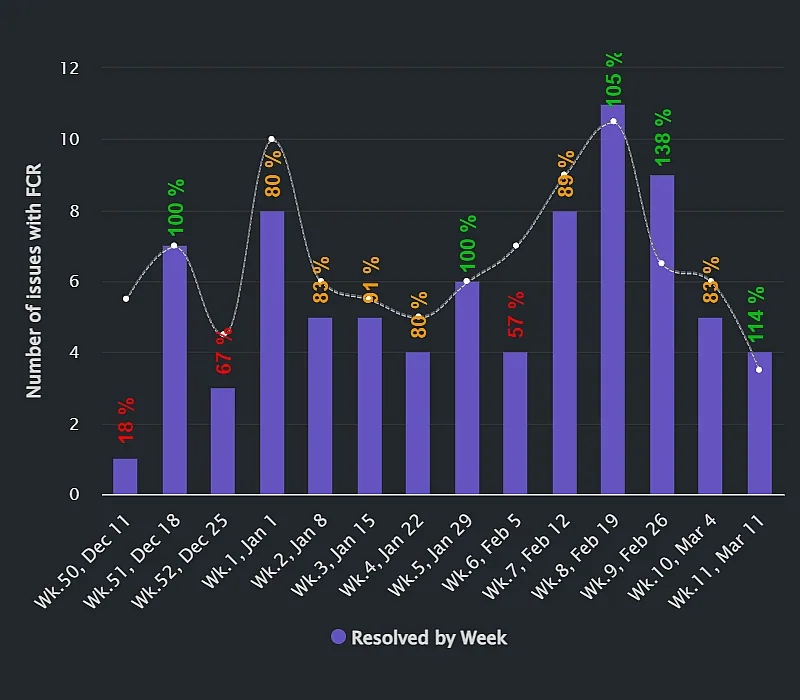
Measure First Contact Resolution with Performance Objectives app. Create report and set target for % of requests resolved on first interaction.
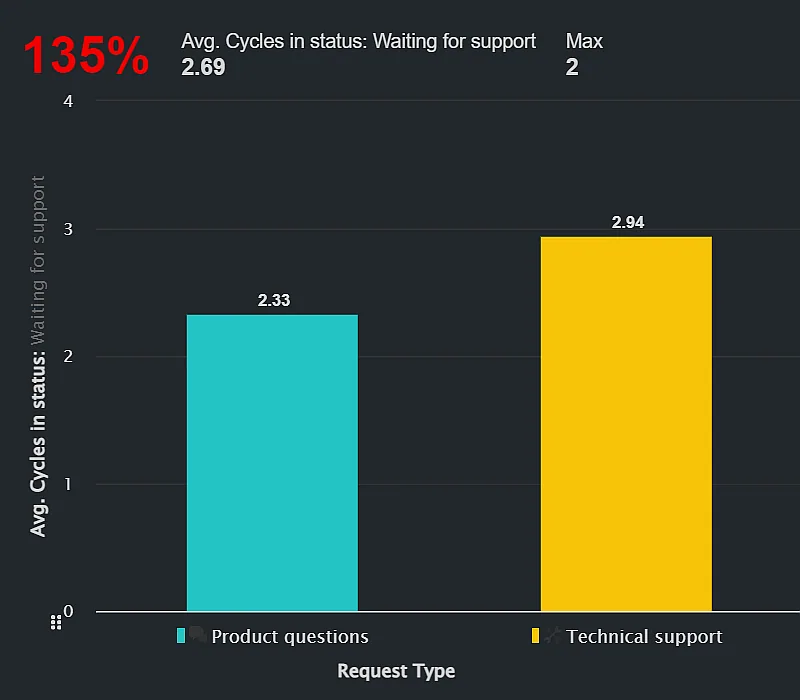
Optimize workflow with 'Cycles in Status' metric in Performance Objectives app. Gain insights via Status Count analysis for enhanced performance.
3 metrics to calculate Mean Time to Resolve in Jira using the Performance Objectives app, based on your parent Jira product and preferences.
Postal Address:
47A Cherni Vrah Blvd., fl.4-5, Puzl, 1407 Sofia, Bulgaria
Email: office@devacrobats.com