

Jira Software
Beyond the Jira Velocity Report: Enhancing Multi-Sprint Reporting
Learn how the Jira Velocity Report compares to Sprint Commitment charts, and what it means for sprint performance and analysis.
Jira provides robust features for managing workflows and tracking the current status of issues, but its built-in reports have limitations when it comes to visualizing historical trends – specifically, how the number of open (unresolved, or in a particular status) issues changes over time. For many project managers, observing whether the backlog is growing or shrinking over time is essential for effective planning and evaluating progress.
Tracking historical open issues, rather than just the current state, helps teams move beyond reactive ticket management and toward long-term backlog health analysis. This type of report is a frequently requested feature in the Jira community, as it enables teams to identify trends, measure the impact of process changes, and communicate progress clearly over weeks, months, or quarters.
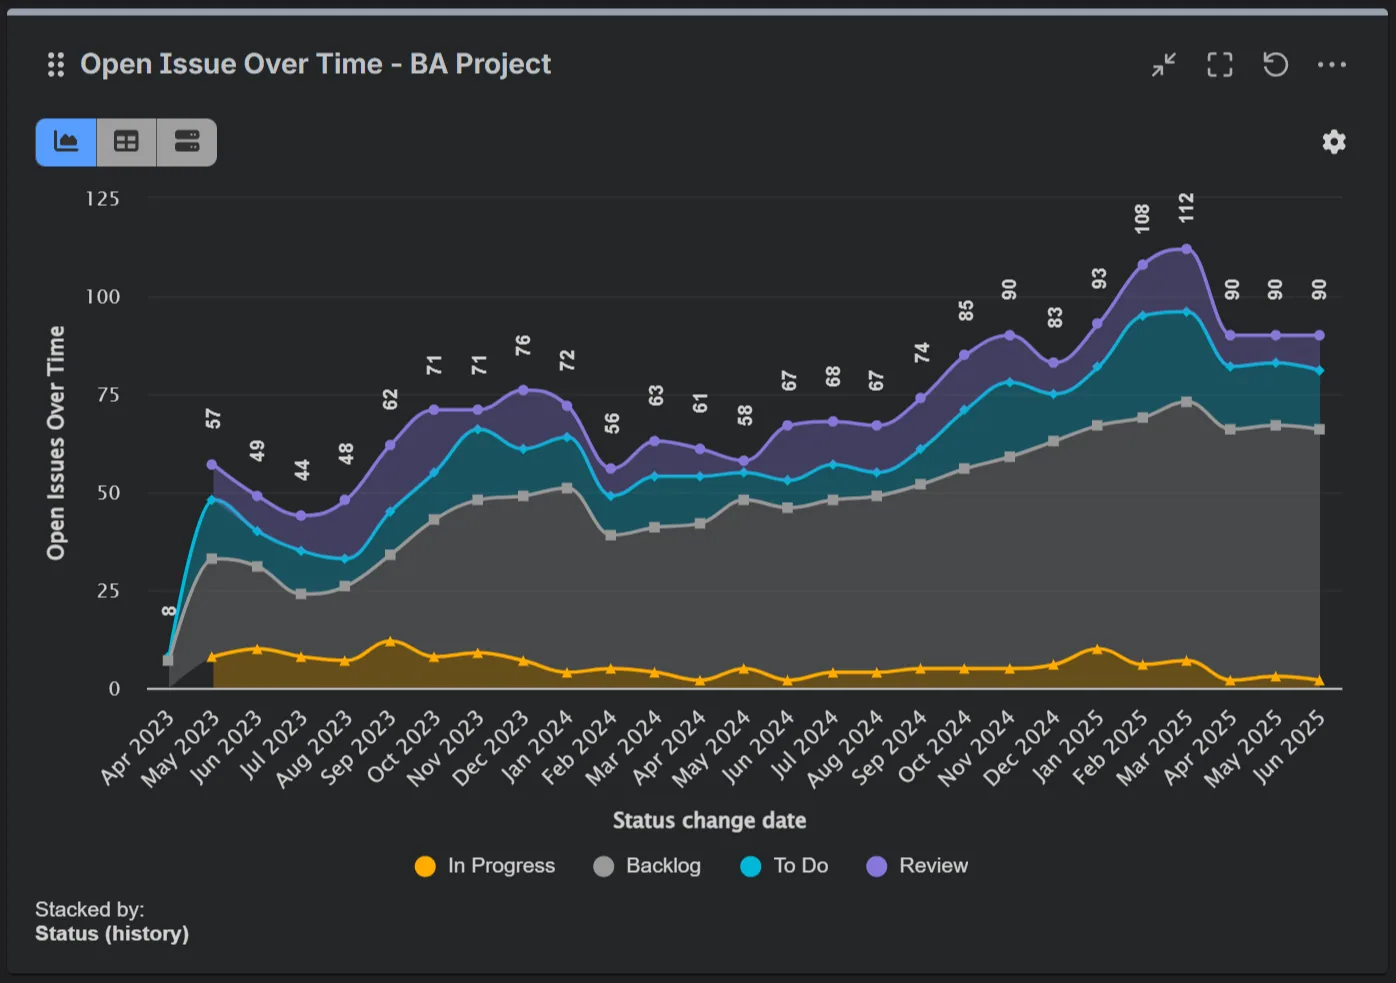
The demand for tracking historical open issues isn’t about creating pretty charts. It’s about gaining practical insights to support informed decision-making. Here’s how it helps:
For instance, a support team using Jira Service Management might monitor the number of issues in “Waiting for Support” or “Waiting for Customer” status each week. This helps reveal workload pressure and capacity issues, or seasonal patterns.
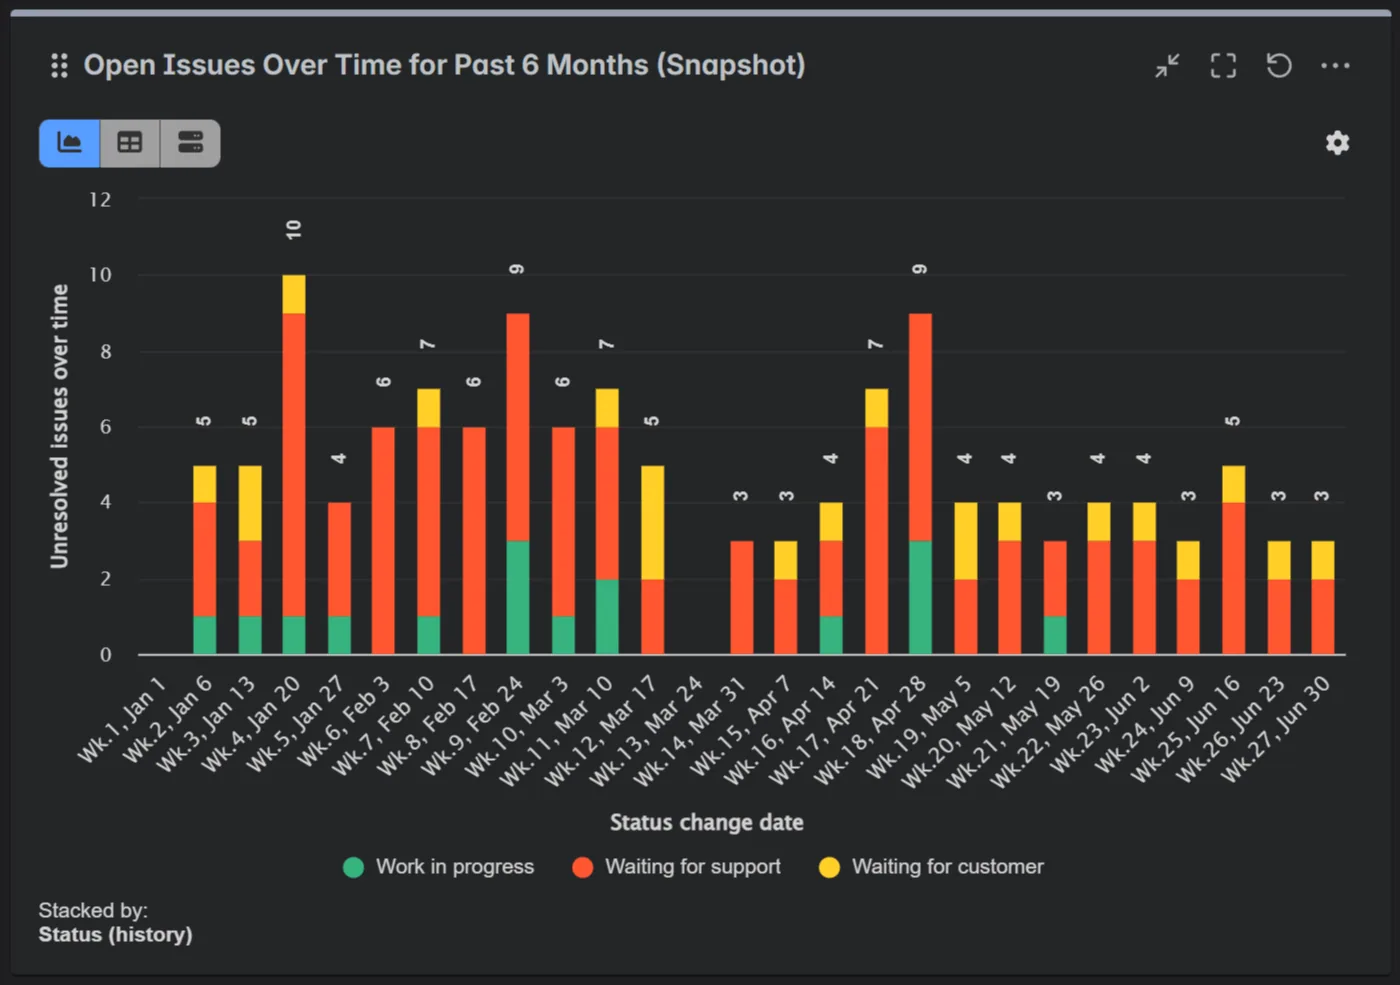
While this specific historical report isn’t a part of Jira’s native toolkit, the Atlassian Marketplace offers a solution. The **Performance Objectives app for Jira **is designed to fill this (and many other) need by providing a flexible “Number of issues over time in status” metric.
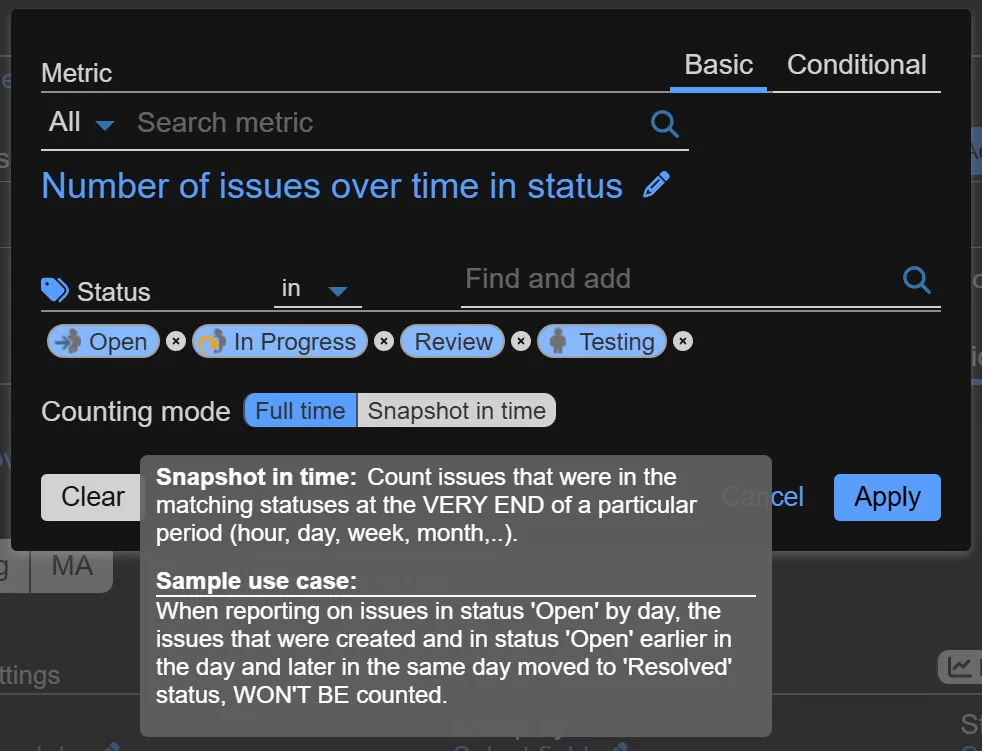
With the Performance Objectives app, you can add a gadget to your Jira dashboard that accurately visualizes this trend for any status or combination of statuses you choose. Choose between** bar chart** with the Performance Objectives gadget and** line/area** chart with the Performance Trend gadget. Whether you want to track ‘Open’ and ‘In Progress’ bugs, ‘Waiting for Support’ tickets, or custom statuses specific to your workflow, the “Number of issues over time in status” metric provides the flexibility you need. It offers two distinct counting modes to fit your reporting needs:
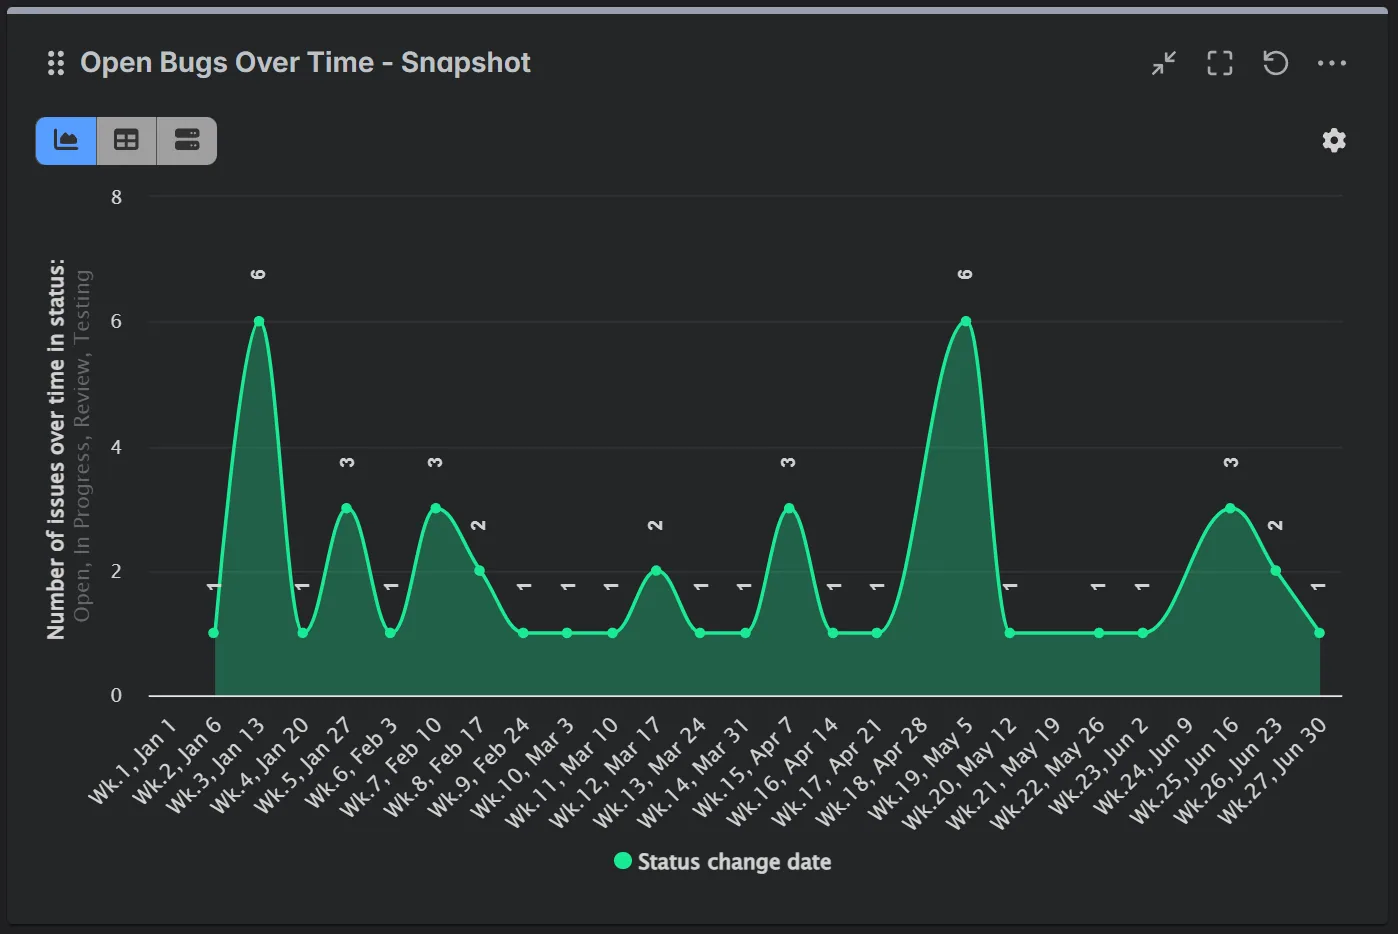
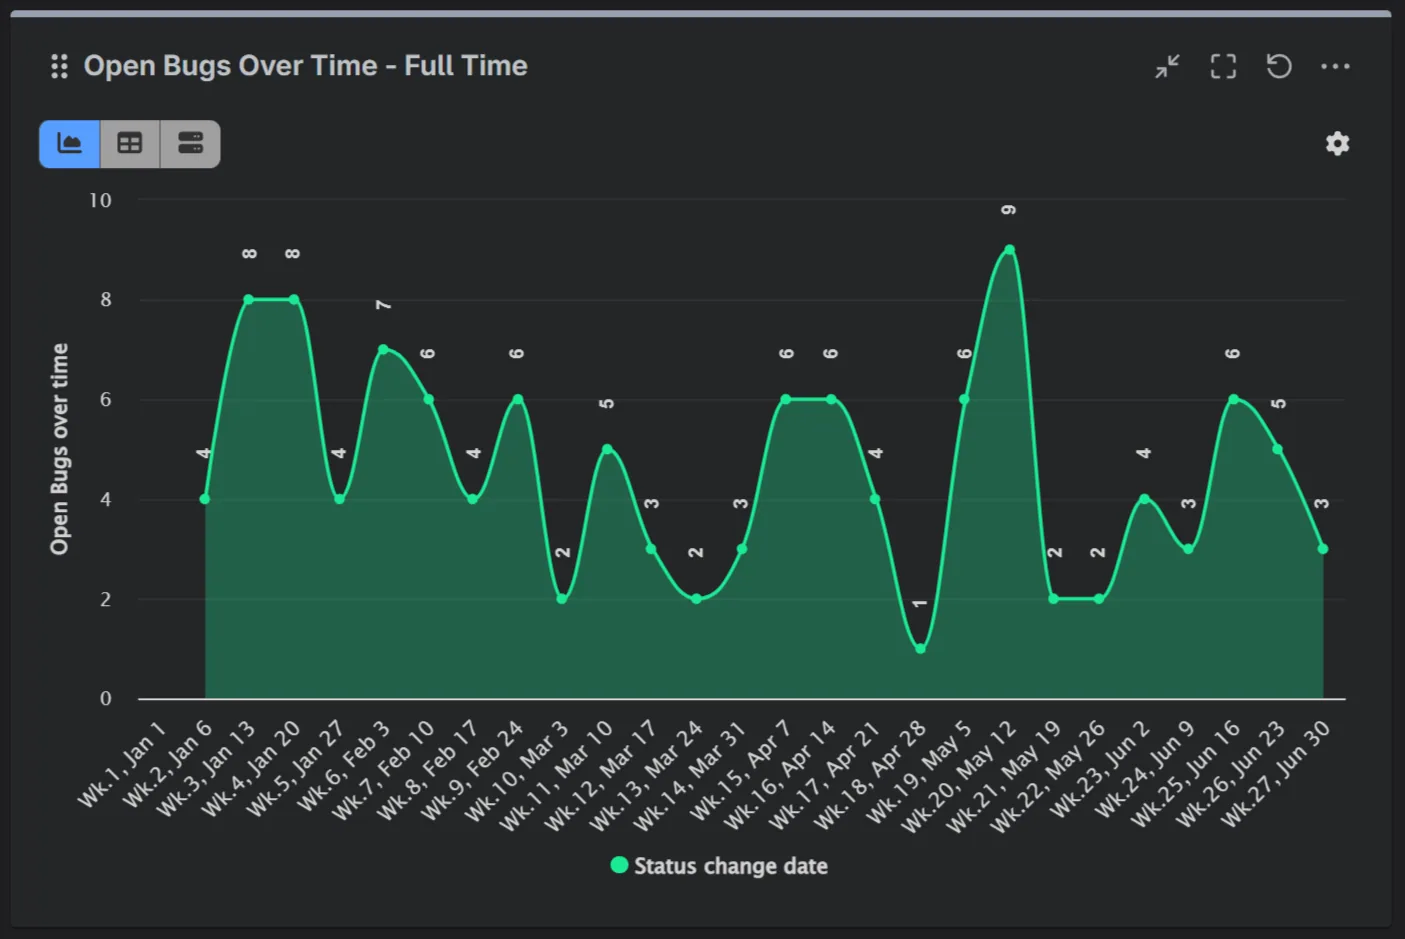
Use the “Status was” option in the app’s data source settings to filter issues that were in the selected statuses at the start of your chosen reporting timeframe. Be sure to select the same statuses when configuring the metric to ensure consistency.
When using the “Number of issues over time in status” metric, the “Status Change Date” field is automatically selected in the Display by setting to ensure accurate reporting based on when status transitions occurred.
Additionally, the app offers a field called “Status (history)”, which allows you to display the metric based on the historical statuses of issues – unlike the Jira system field “Status“, which always reflects the current status. This enables you to analyze status transitions over a defined time frame, providing deeper insight into workflow dynamics.
Stop fighting with spreadsheets and start making data-driven decisions. By adding this capability to your Jira instance, you can move from guesswork to certainty and provide every stakeholder with a clear, accurate picture of your team’s progress.
Start a free 30-day trial of the Performance Objectives app from the Atlassian Marketplace today!

Learn how the Jira Velocity Report compares to Sprint Commitment charts, and what it means for sprint performance and analysis.
Enhance your Jira defect management reporting with the Performance Objectives app. Configure advanced bug tracking reports and monitor key QA KPIs.
Stop exporting Jira data to Excel. Create custom formula reports and KPIs directly in Jira using the Performance Objectives app.
DevAcrobats develops reporting apps for Jira that extend its capabilities, enabling teams to streamline workflows and enhance performance.
Postal Address:
47A Cherni Vrah Blvd., fl.4-5, Puzl, 1407 Sofia, Bulgaria
Email: office@devacrobats.com