
Jira Software
Beyond the Jira Velocity Report: Enhancing Multi-Sprint Reporting
Learn how the Jira Velocity Report compares to Sprint Commitment charts, and what it means for sprint performance and analysis.
Every Agile team is familiar with the built-in Jira Sprint Report and the Burndown Chart. Are you getting all the answers you need from these standard reports? Your Sprint Report shows the team completed 50 story points, but to understand how much of that was unplanned scope creep, you have to dig into the Status Report and manually sum the points from issues added after the sprint started. The report provides the raw data, but it doesn’t give you an at-a-glance breakdown of committed vs. unplanned work. Your Burndown chart looks okay, but you have a nagging feeling that “zombie” stories are being rolled over from sprint to sprint, hiding the real problems.
Both reports are single-sprint tools. You must select the specific sprint you want to analyze from a dropdown. They do not offer a view that aggregates or compares data across several sprints. This makes it difficult to answer questions like, “How has our ratio of completed vs. incomplete work changed over the last quarter? or “Is the amount of unplanned work increasing over time?” without manually opening and comparing multiple reports.
The Velocity Chart is a great out-of-the-box solution for multi-sprint analysis in Jira. However, it only shows two data points (commitment vs. completion) and doesn’t provide the rich, detailed context that an advanced, multi-sprint report could. Another known drawback in Jira Cloud is that the Velocity Chart only displays data for the last 7 sprints – a limitation that many users find frustrating when trying to analyze long-term trends.
While Jira’s native reports provide a good current overview, they often lack the depth to drive true performance improvements. This guide will show you how to move beyond the standard Jira sprint reports and build advanced sprint reports for Jira that turn your dashboard from a simple status update into a source of actionable insights for data-driven decision-making.
Before we dive into the “how,” let’s look at the “what.” The sample Jira dashboard below is configured entirely with the Performance Objectives app. Each chart is designed to answer a specific question. You can see a team’s actual velocity with a set performance target right next to a chart diagnosing sprint spillover. You can track scope creep in one gadget while monitoring the lifecycle of individual stories in another. Moreover, you can analyze ratios and monitor trends over time. Advanced sprint reports for Jira are possible when you have the right building blocks.
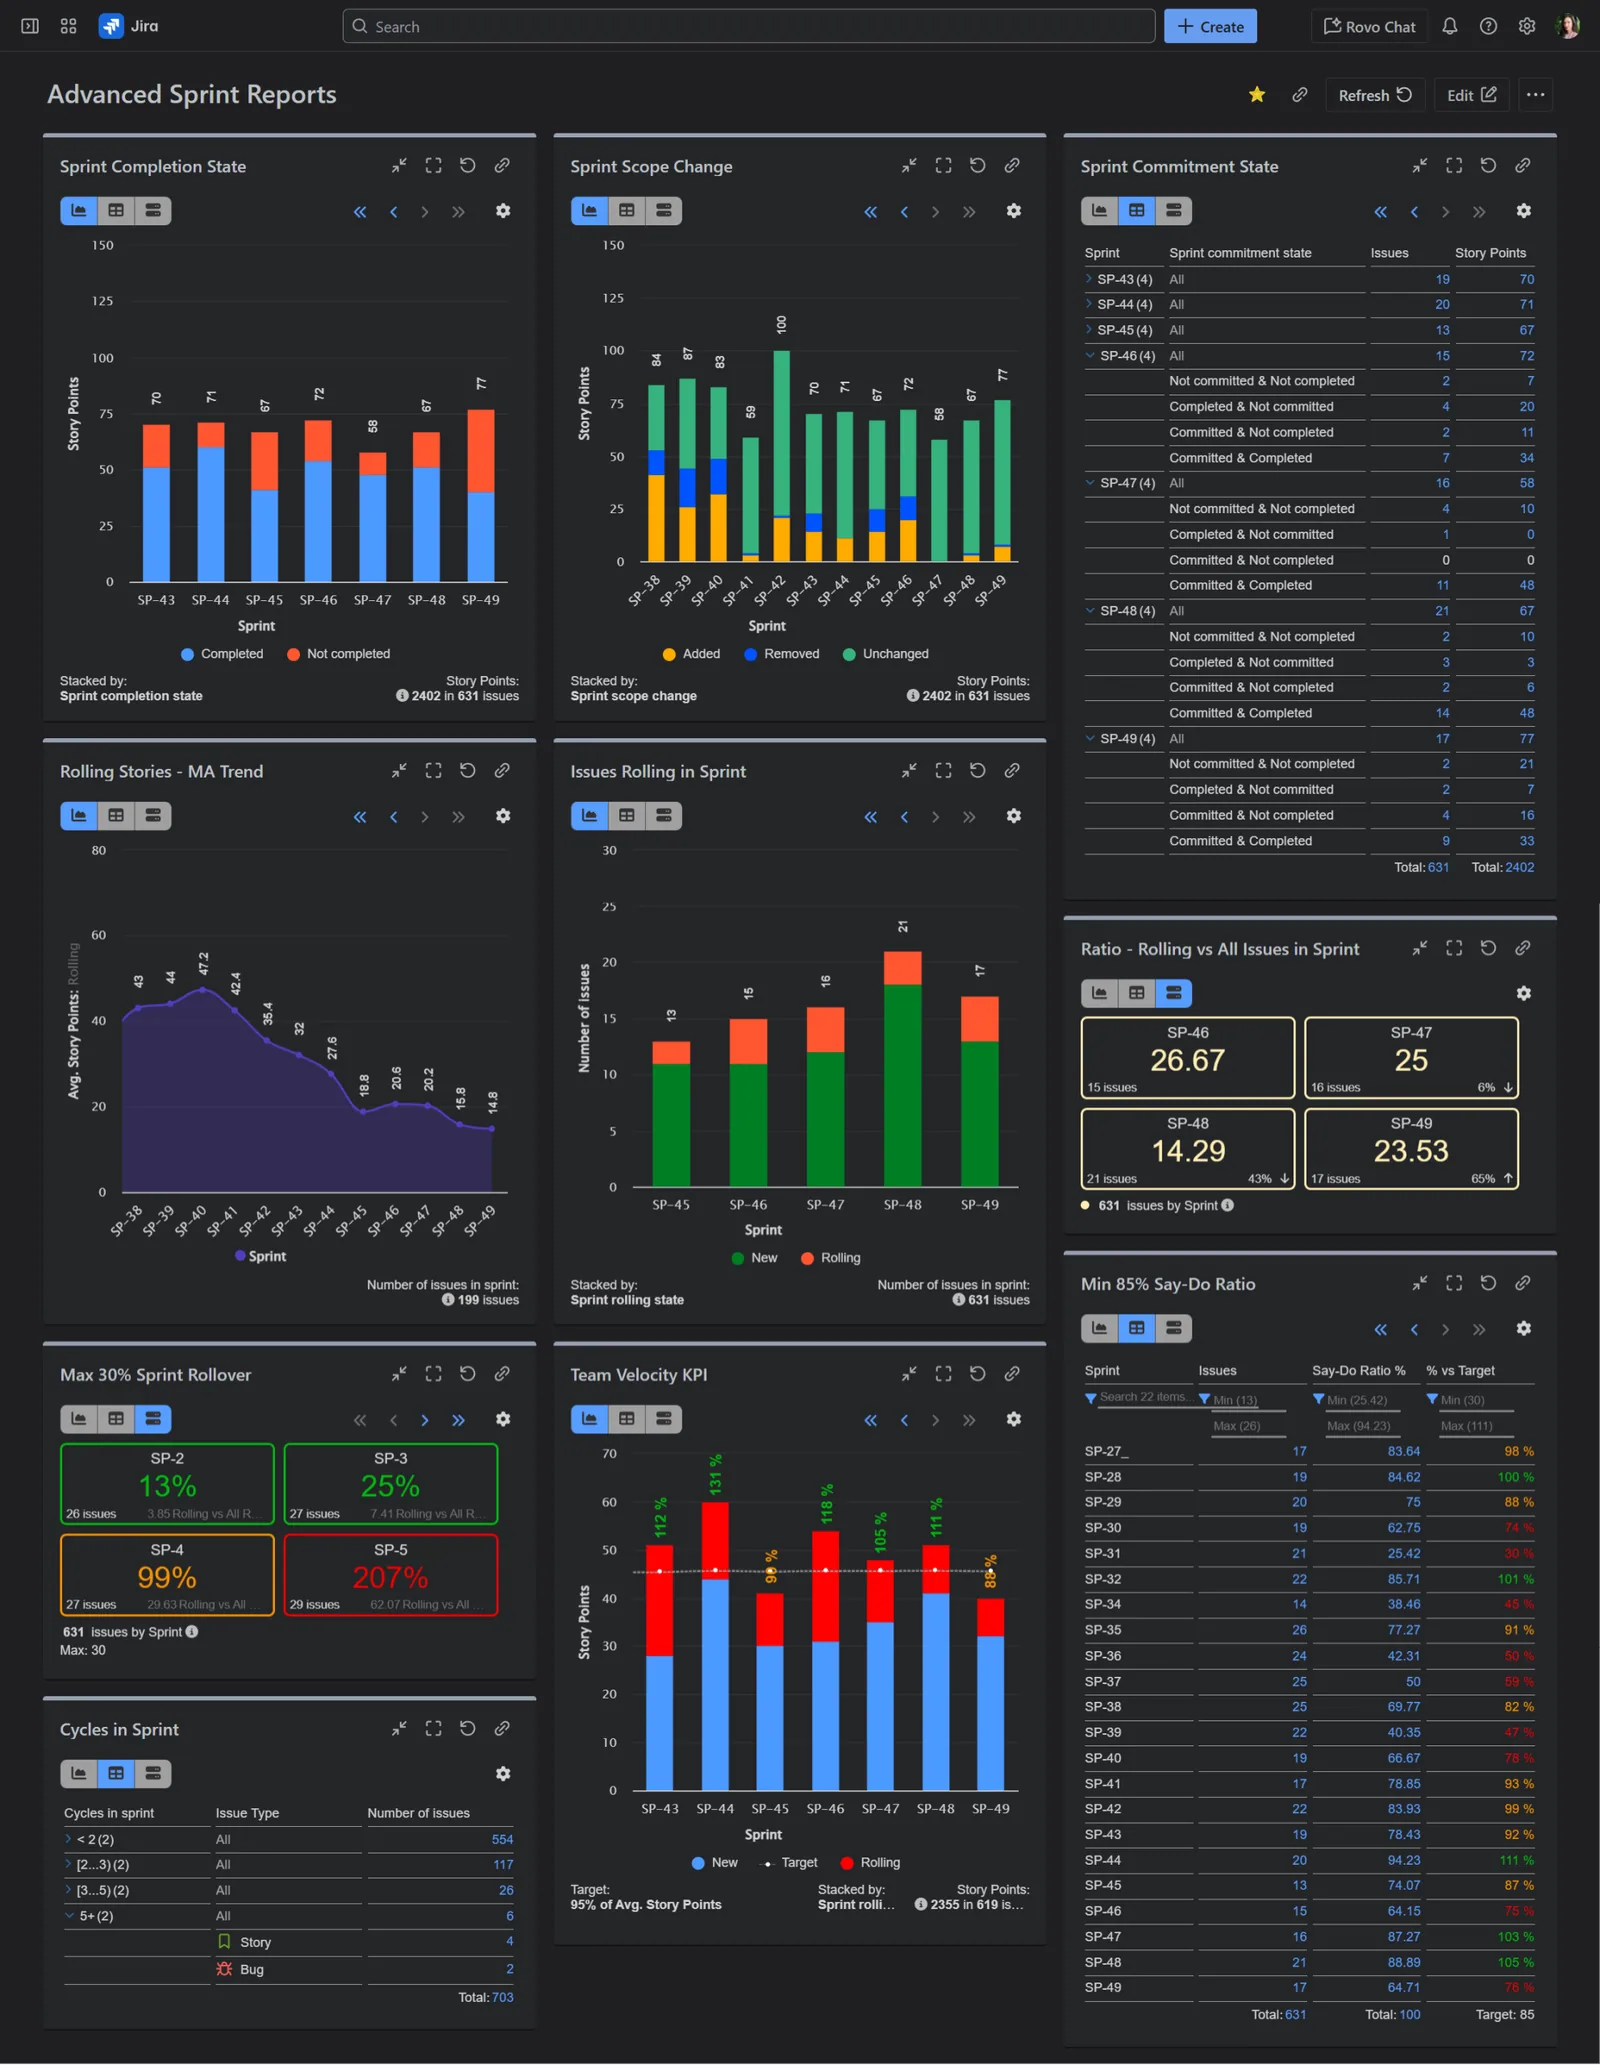
To address the limitations of native Jira reporting, our Performance Objectives app comes with a set of sprint related built-in fields and metrics. These are designed to provide the deep, granular insights that native reports and gadgets lack, allowing you to build truly custom and meaningful sprint reports for Jira.
| Field Name | What It Tracks | Key Question It Answers |
|---|---|---|
| Sprint – All, First/Last, Completed/Not Completed | Lets you filter sprints based on how an issue moves through them – including the first sprint the issue appeared in, the last sprint it was part of, the sprints where it wasn’t completed, and the sprint where it was finally completed. If the ‘All’ option is selected, the sprint view will display the full issue history across all relevant sprints. | What’s my team’s actual velocity? |
| Sprint Commitment State | It categorizes every issue in a sprint into one of four groups: 1. Committed & Completed: Represents issues or story points initially added to the sprint and successfully completed within it. 2. Committed & Not Completed: Signifies issues or story points initially added to the sprint but left uncompleted by the end of the sprint. 3. Completed & Not Committed: Denotes issues or story points added after the sprint’s start and successfully completed in it. 4. Not Committed & Not Completed: Stands for issues or story points added after the sprint’s start and left uncompleted at its conclusion. | How well do we deliver on our promises? |
| Why do we fail to complete planned work? Are we overcommitting or facing blockers? | ||
| How much “hero work” or scope creep is happening, and is it preventing us from finishing our commitments? | ||
| How much noise and wasted effort is created by adding and then dropping work within the same sprint? | ||
| Sprint Rolling State | Displays issues as ‘Rolling’ when carried over from an earlier sprint, or ‘New’ when first added in the respective sprint. | Are we consistently overcommitting? What is the impact of “spillover”? |
| Sprint Completion State | Shows the completion state, regardless of whether the issues were committed at the start or added at any point after the sprint started. | What is the final scope of work we completed in this sprint? |
| Sprint Scope Change | Categorizes issues as added, removed, or unchanged after the sprint start. | How stable is our sprint scope and can we quantify mid-sprint changes? |
| Cycles in Sprint | A numeric count of how many times issues moved from one sprint to another. | Which specific issues are draining the most team capacity over time? |
| Number of Issues in Sprint | Measure velocity and capacity by issue count instead of or in addition to Story Points. | How does our throughput look when measured by work item count instead of story points? |
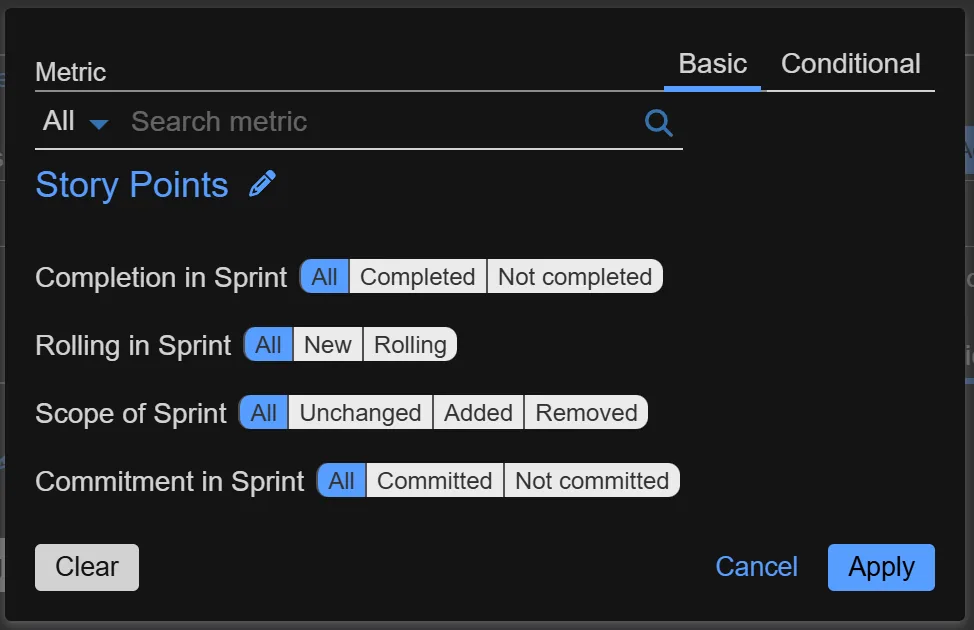
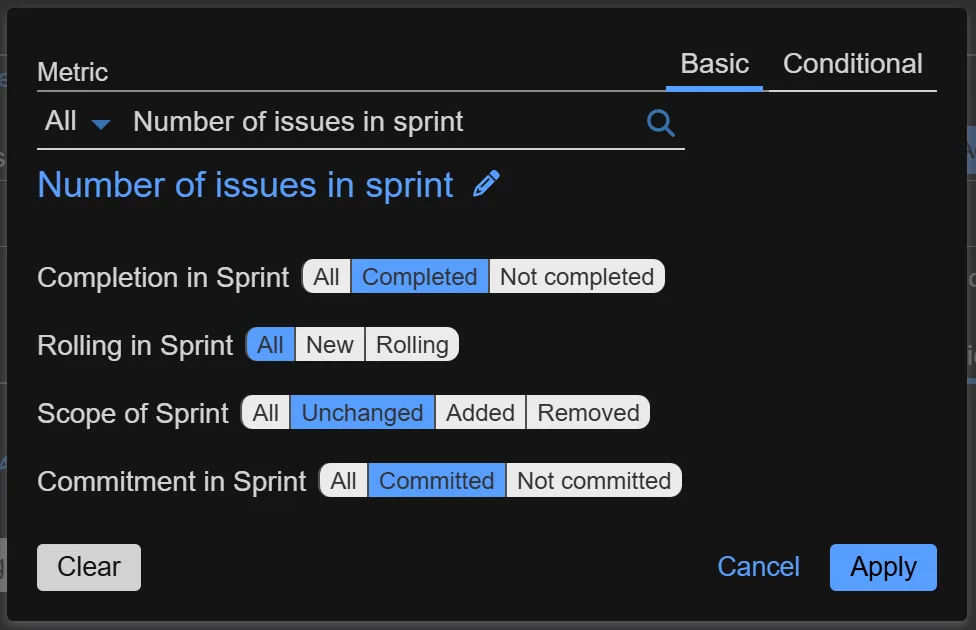
You can significantly enhance the standard Jira metric ‘Story Points’ by using advanced filtering. These powerful options become available specifically when you configure a report that uses the ‘Sprint’ field as a ‘Display by’ field. This selection unlocks four extra dimensions for metric analysis, letting you apply contextual filters to see, for example, only the issues or story points that were completed, added as scope creep, or spilled over (rolling) into the next sprint. These same filters can also be applied to the app’s metric, ‘Number of issues in sprint’.
Here are the advanced filtering options available by the Performance Objectives app and the value they bring to your Agile reporting:
Options: All, Completed, Not completed
Value: Instead of seeing the total scope, you can isolate your team’s delivered output by selecting Completed, or diagnose sprint failures by focusing only on what was Not completed. This provides a much clearer picture of actual velocity versus planned work.
2. Filter by Rolling Status This dimension allows you to differentiate between work that was planned for the sprint and work that was carried over from a previous one.
Options: All, New, Rolling
Value: By selecting Rolling, you can precisely quantify sprint spillover. This helps you answer critical questions like, “How much of our capacity is consumed by unfinished work from previous sprints?” and “Is our team consistently overcommitting?”
3. Filter by Scope Change This filter focuses on when an issue was introduced to the sprint, helping you understand the impact of mid-sprint changes.
Options: All, Unchanged, Added, Removed
Value: Isolate the impact of scope creep by filtering for issues Added after the sprint started. Measure commitment stability by focusing on Unchanged work. This allows you to quantify disruptions and have data-driven conversations about protecting sprint goals.
4. Filter by Commitment Status This lets you measure performance against the team’s original promise at the start of the sprint.
Options: All, Committed, Not committed
Committed issues to see how well the team delivered on its original plan. This provides a pure measure of predictability, separate from any unplanned work that was later added to the sprint.When All is chosen for any of these metric filters, the metrics function like the default ‘Number of issues’ and ‘Story points’, giving you a familiar baseline, which can be further enhanced with using the sprint-state fields for ‘Stack by’, for example. By leveraging these advanced filters, you can move beyond generic reports to create specific, contextual, and insightful charts that show the true dynamics of your team’s sprint performance.
We will dive into the Sprint field and its rich filtering options. Think of it not just as a label, but as a powerful lens. It lets you control which version of a sprint’s story you want to see, solving some of the most frustrating reporting challenges. With Performance Objectives app, when you display your report by “Sprint,” you can move beyond showing “everything” and choose a specific moment in an issue’s lifecycle.
Here’s what each filtering option allows you to do:
| Option | What It Shows | Why It’s a Game-Changer (The Value) |
|---|---|---|
| All in Sprint | The default view, showing every issue that was present in the sprint at any time. | Good for a general overview and powerful in combination with the sprint-state fields for completion, commitment, rolling, scope change. |
| First In | Filter issues by their initial appearance in a sprint. | Show what new work your team commits to in each sprint. |
| Last In | Associates an issue only with the most recent sprint it was a part of. | Track where work currently lives. This helps you understand the final destination of stories that have moved around, cleaning up historical noise. |
| Completed In | Filter issues by the sprints in which they were marked as “resolved” or successfully completed. | This view shows you when value was delivered, regardless of how many sprints the work was planned in. It’s the cleanest way to report on actual velocity. |
| Not Completed In | Filter issues by the sprint in which they remain open or unresolved. | Create a precise “sprint failure” report. This is good for retrospectives, allowing you to isolate and analyze only the work that remained unresolved in any given sprint |
Beyond segmenting your sprint data, with our app, you can fine-tune the scope of your report to eliminate noise and focus only on what’s relevant right now.
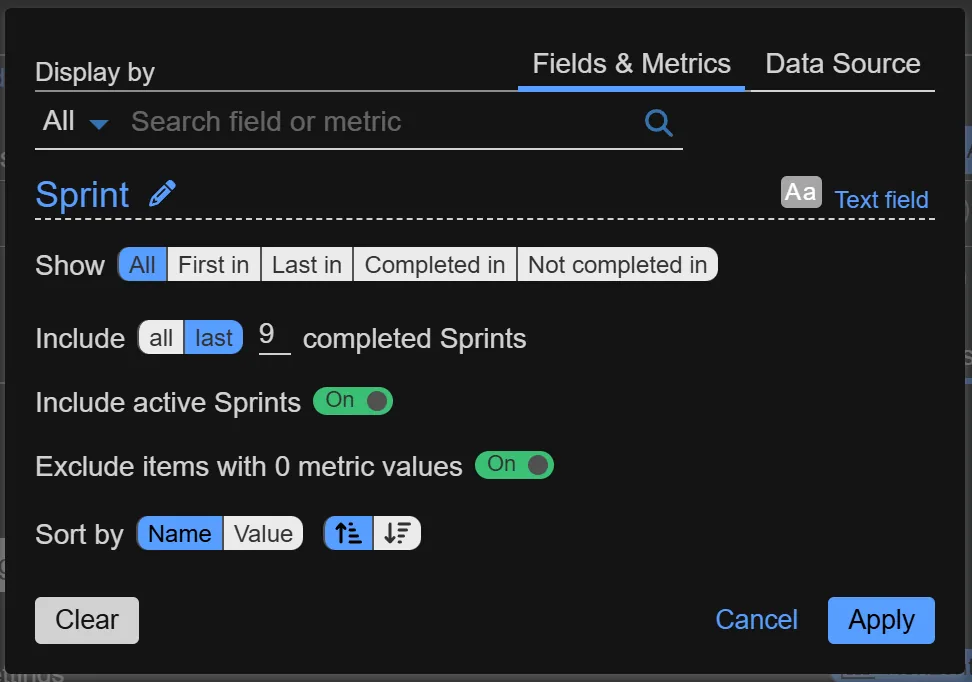
Note that ‘Include Backlog’ is not supported when ‘Include Last [X] completed Sprints’ is switched on.
Configure advanced sprint reports for Jira with the Performance Objectives app available on the Atlassian Marketplace with a 30-day free trial. Browse our comprehensive documentation, watch tutorial videos, and explore KPI examples like Agile Team Velocity Report, Personal Velocity, Say-Do Ratio, andSprint Rollover Ratio to see how you can improve your sprint reporting and performance in Jira.
Learn how the Jira Velocity Report compares to Sprint Commitment charts, and what it means for sprint performance and analysis.
Configure an "Open issues over time in status" report in Jira and track historical trends with Performance Objectives app.
Enhance your Jira defect management reporting with the Performance Objectives app. Configure advanced bug tracking reports and monitor key QA KPIs.
DevAcrobats develops reporting apps for Jira that extend its capabilities, enabling teams to streamline workflows and enhance performance.
Postal Address:
47A Cherni Vrah Blvd., fl.4-5, Puzl, 1407 Sofia, Bulgaria
Email: office@devacrobats.com